

Up to three tree-ring sample files may be displayed in the main screen. Each sample panel displays the sample's skeleton plot. The time series index value plots are overlaid on each other in the top panel. Each panel contains applicable information and control menu buttons.
Tree-Ring Selection
The red dots shown in Fig. 1.1 indicate which ring is currently selected. The ring selection may be changed by:
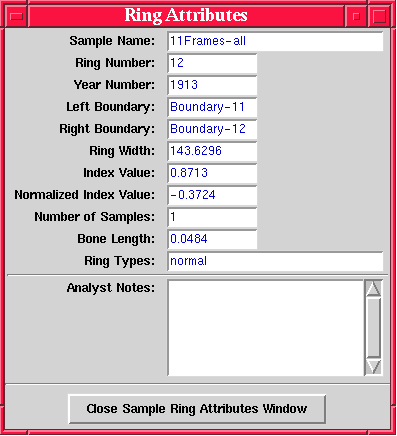
See Fig. 1.4.4 for the data displayed for the currently selected tree-ring.
Sample Positioning
The position of the sample on the screen is indicated in sample information. The number indicates the offset (in years) from the left edge of the display (position 0). A sample's position may be changed by:
The sample's time series index value plot overlay is moved as the sample's position moves.
Display Scrolling
The entire display may be scrolled to the left or right by clicking and dragging the scroll bar in the desired direction. Clicking the right or left arrows on the scroll bar will result in scrolling the entire display one year to the left or right.
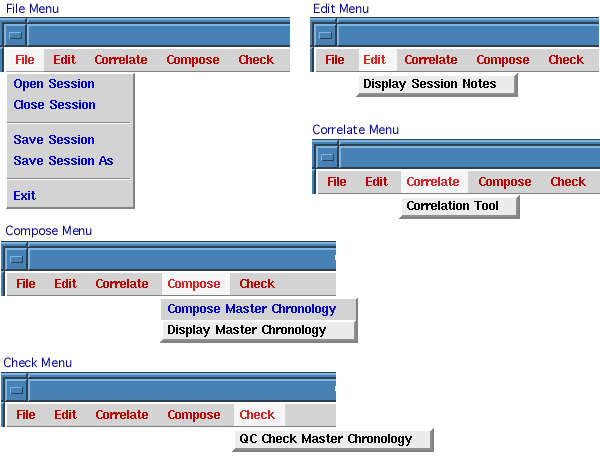
See Session FIles for a discussion of File and Edit menu commands.
See Correlate Tool for a discussion of the Correlate menu commands.
See Compose Tool for a discussion of the Compose menu commands.
See Check Tool for a discussion of the Check menu commands.
Time Series Plot
Time Series Controls
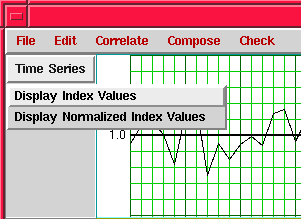
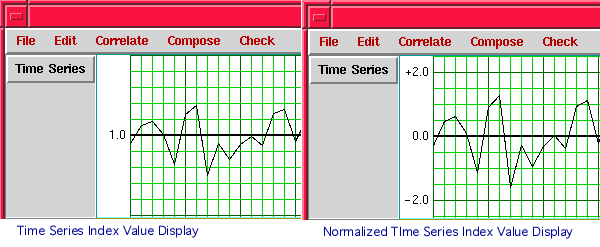
The time series plot display may be toggled between raw index values and normalized index values using the Time Series control menu button. Raw index values indicate the width of the ring relative to the series mean ( = 1.0) after detrending. Normalized index values indicate the width of the ring as the number of standard deviations from the series mean after detrending.
Since the standard deviation may be significantly different from one sample to another, normalized index values may not be appropriate for pattern matching for dating purposes.
Sample Skeleton Plot
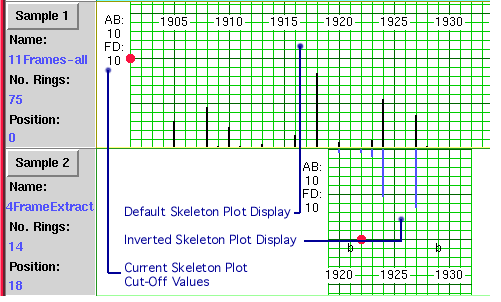
Each sample panel contains a graphic display for the sample's skeleton plot. The skeleton plots may be inverted and repositioned as required to determine matching positions.
Sample Controls
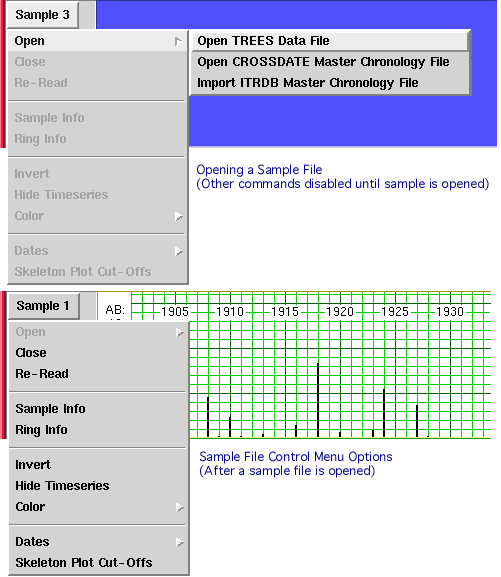
The CROSSDATE program opens the following file types:
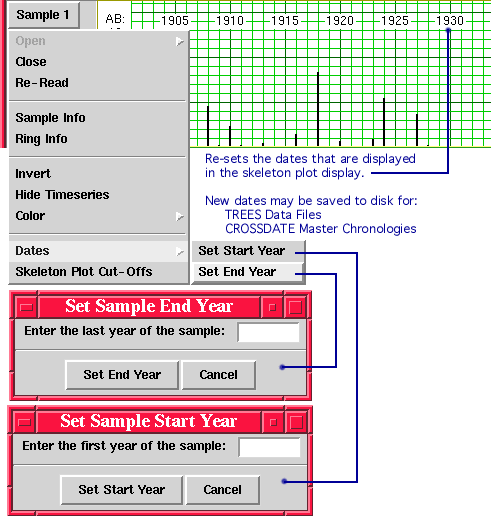
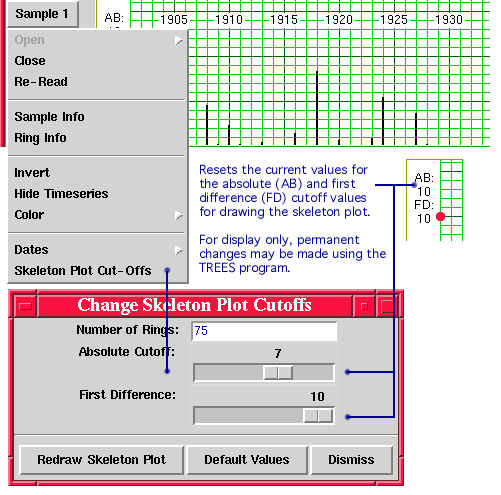
After a sample file is opened, the following menu commands are available:
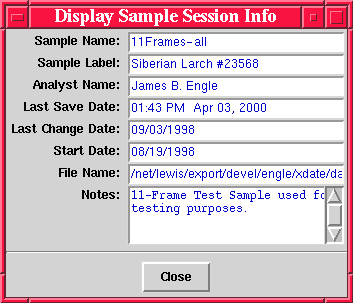
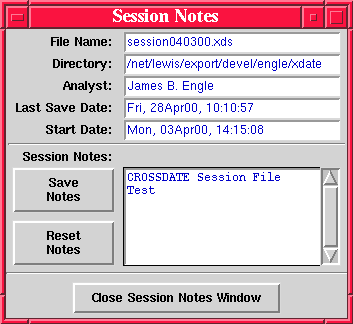
A CROSSDATE Session File (extension .xds) is a user convenience for storing and retrieving a CROSSDATE Session. The Session File makes a record of the sample files that are open, including their color, position, currently highlighted ring, invert status, and time series plot display status. Notes may be stored with a session file using the Edit -> Display Session Notes function. Session information is shown above in Fig. 1.5.
Sessions are opened, closed, and saved to disk using the File commands from the main menu.
![]()
Last Updated: June 2000
University of Arizona
Questions and Comments: trees@ece.arizona.edu
Digital Image Analysis Laboratory and
Laboratory for Tree Ring Research © 2000