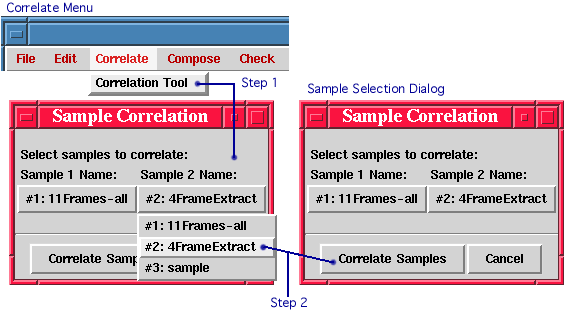


The main screen must contain at least two samples in order to use the correlation tool. Clicking the Correlate -> Correlation Tool menu button brings up the Sample Selection Dialog box as shown in Fig. 2.1 above. The Sample Selection Dialog box allows for selecting two samples to correlate. If Sample 1 and Sample 2 are the same, no correlation will be performed.

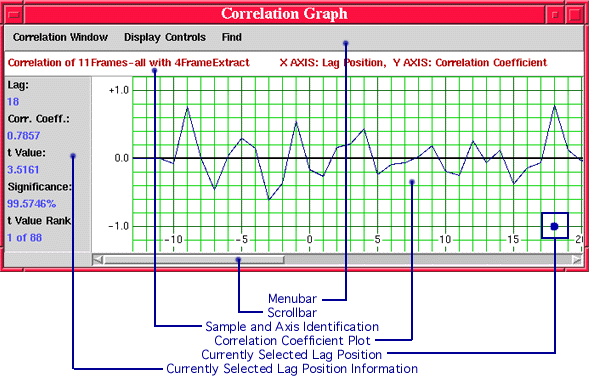
The Correlation Graph Window appears as a new window after clicking Correlate Samples from the Sample Selection Dialog box. The window contains the following sections:
The Correlation Tool calculates the correlation coefficient, t-value, significance, and t-value rank for each possible overlap lag position between the two samples. The Correlation Graph WIndow plots the resulting correlation coefficient and ranks each lag position by its t-value. By default, the window scrolls to the lag position with the highest t-value upon initial display (t-value rank = 1 is the highest). The number of overlapping tree-rings is taken into consideration in the calculation of the t-value. The t-value is used to quantify how well the two samples match at a particular lag position. Significance quantifies the degree to which the correlation coefficient arose by chance. (larger significance <=> lower possiblility of chance occurrence)
For example, in Fig. 2.2 lag position +18 is shown as the "best" match point, however, the correlation coefficient at lag position -9 is very high also. There are only five tree-rings used to determine the correlation coefficient for position -9. Position +18 uses 14 tree-rings and has a correspondingly higher t-value.
Lag Position Selection
The blue dot shown in Fig. 2.2 indicates which lag position is currently selected. The lag position selection may be changed by:
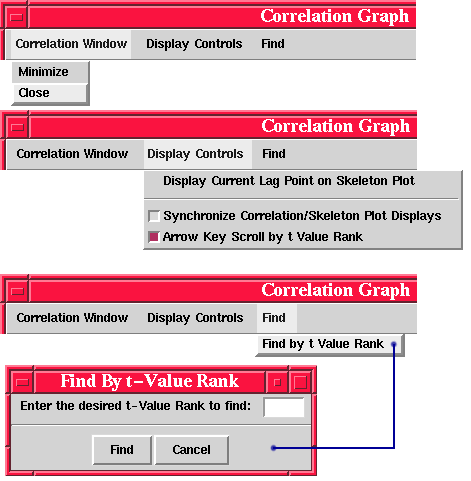
See the Display Controls Menu (Fig. 2.3) below for additional selection and scrolling features.
Display Scrolling
The entire display may be scrolled to the left or right by clicking and dragging the scroll bar in the desired direction. Clicking the right or left arrows on the scroll bar will result in scrolling the entire display one lag position to the left or right.
Correlation Tool Menus and Options

Correlation WIndow -> Minimize - Shrinks the Correlation Graph WIndow into an icon on the desktop.
Correlation Window -> Close - Closes the Correlation Graph Window. No data is retained upon closing the window.
Display Controls -> Display Current Lag Point on Skeleton Plot - Causes the sample skeleton plots to be displayed in the main screen positioned at the current lag position.
Display Controls -> Synchronize Correlation/Skeleton Plot Displays (Check Button) - Synchronizes the display of the sample skeleton plots with the current lag position. Whenever the current lag position changes in the Correlation Graph Window, the main screen skeleton plots are immediately repositioned accordingly. Whenever the samples are repositioned in the main screen, the corresponding lag position is shown in the Correlation Graph Window. (Default is OFF).
Display Controls -> Arrow Key Scroll by t Value Rank (Check Button) - Changes the function of the left and right keyboard arrow keys to scroll by sequential t-value rank rather than by sequential lag position. For example, if Arrow Key Scroll by t value rank is checked, and the current lag position is at rank 4, then pressing the left arrow key will scroll the display to the lag position with rank 3 and pressing the right arrow key will scroll the display to the lag position with rank 5. (Default is OFF).
Find -> Find by t Value Rank - Entering a number between 1 and the number of possible overlapping lag positions results in the display immediately scrolling to display the lag position with the desired t-value rank.
![]()
Last Updated: June 2000
University of Arizona
Questions and Comments: trees@ece.arizona.edu
Digital Image Analysis Laboratory and
Laboratory for Tree Ring Research © 2000