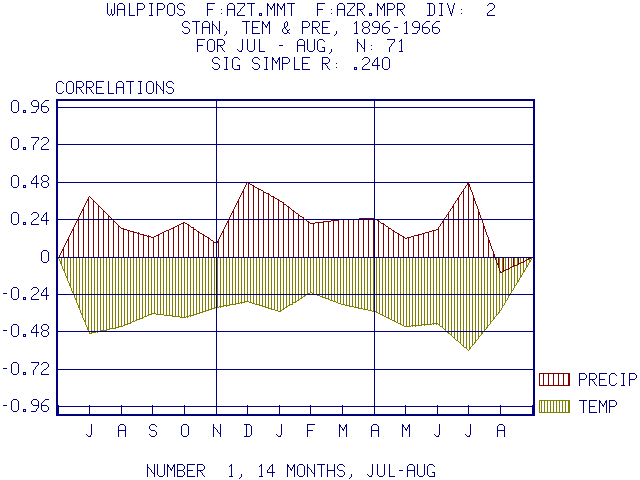

This is a plot of the correlations for the Walnut Canyon Ponderosa Pine chronology against monthly temperature and precipitation from that climatic region starting with July of the year prior to growth and ending with August near the end of the growing period. The units of the vertical lines are the 95% confidence limits, so that all values greater or less than +\-0.24 are significant at the 0.95 probability level. Note that on this drought site that the correlations with precipitation are positive (6 are significant) except for August, and the correlations with temperature are negative (13 are significant) representing inverse relationships.
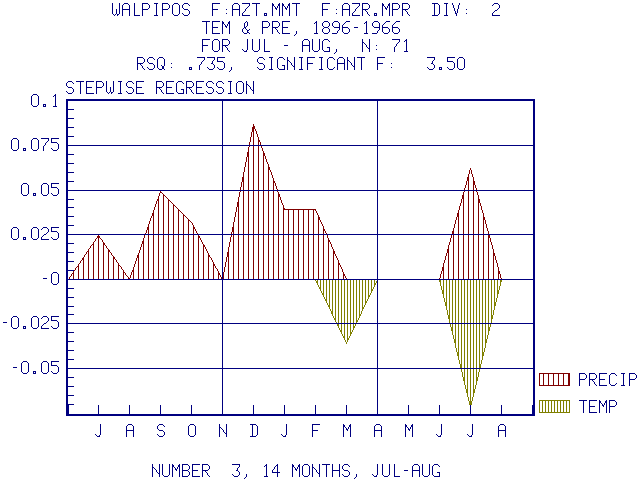
This is the solution of the response relationship using a stepwise multiple regression analysis. 7 variables of monthly precipitation and two variables of temperature were significant predictors of growth. The coefficients for temperature are negative representing inverse relationships. However, this type of analysis using multiple regression leads to biased error estimates and not all of the coefficients may really be significant.
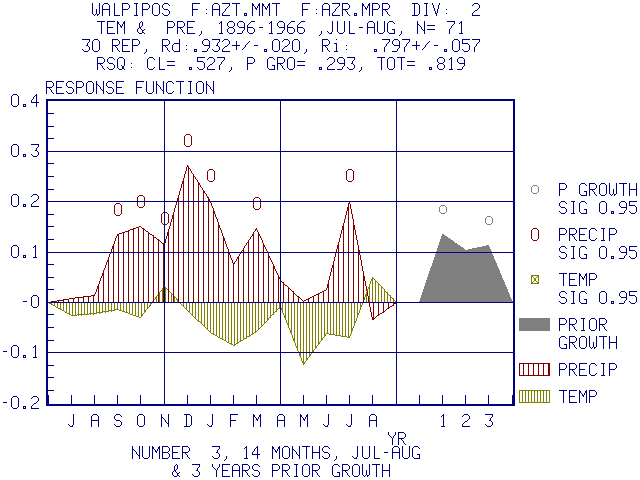
An Example of a Bootstrapped Response Function in PRECON using the same data as above.
Note that 7 precipitation variables are still significant but no temperature variables remain significant. The collinearities among temperature variables and with precipitation added error and the bootstrap response measured this directly by replicate random sampling and provided a more realistic estimate of the tree response to climate. In addition, prior growth could be added as a predictor in the response analysis and coefficients for lags of 1 and 3 years were significant.
Such a comparison among a number of techniques helps one interpret the results. Using simple correlation, there is a high probability that many simple correlations will appear significant when in reality they are not. Multiple regression has similar difficulties with an over estimate of significant predictors of growth. The bootstrapped response estimates the error using random sampling from the data. It indicates no temperature variables are significant and prior growth should be included unless the series has been modeled to remove autocorrelation and moving average components in the response.
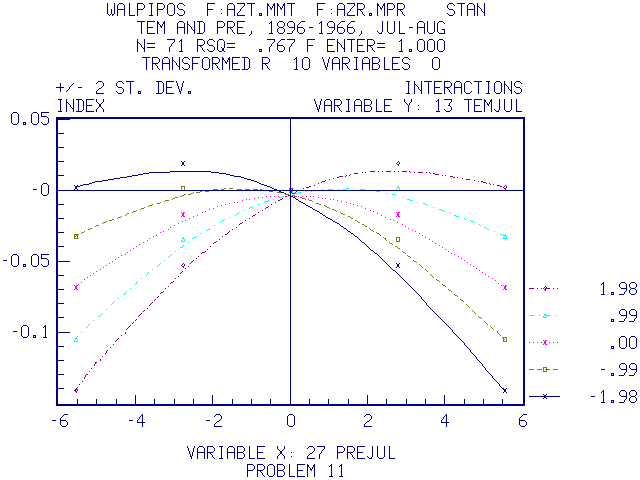
Here precipitation in July near the end of growth has a different curvilinear effect on ring width in Walnut Canyon Ponderosa Pine depending upon the temperature in July (shown on the left). If the temperature is high (+1.98) low values of precipitation greatly reduce growth but high values have little effect. If temperature is low (-1.98) low precipitation does not become particularly limiting but there is a growth reduction if precipitation is high. Presumably water stress was less important and the associated cloud cover and coolness associated with high precipitation may have caused growth to be less or to cease. Such statistical results can be examined more closely using the physiological model of growth.
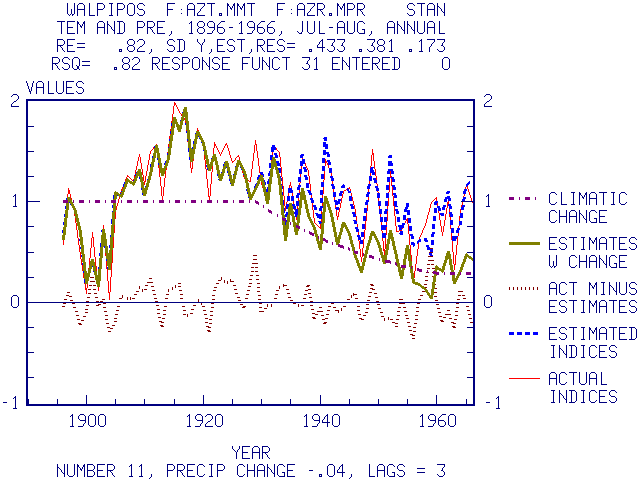
In this example an annual precipitation decrease of 0.04% per year was hypothesized from 1930 to 1960. The actual, estimated and, residuals for the data are plotted along with the hypothesized change; and the estimates of the growth reduction resulting from the climatic change are applied to the actual data used in the analysis. The change can be applied to different variables and different seasons depending upon the hypothesis.
Please Send me Comments, Questions, or Suggestions.
Prepared by Harold C. Fritts hfritts@LTRR.arizona.edu -- Last updated April 7, 1999