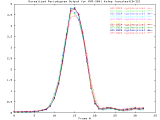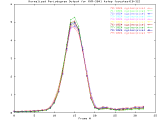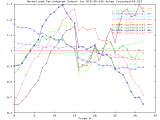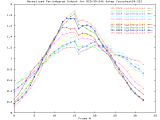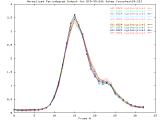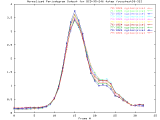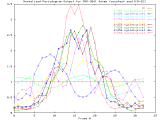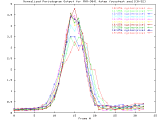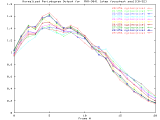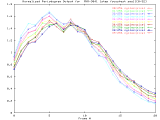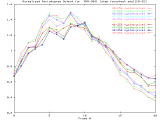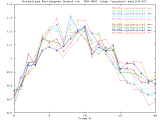
Description of Automatic Focus Detection Technique


Overview of the Technique

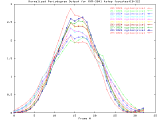
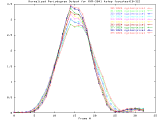
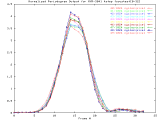
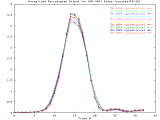
The technique used to determine whether or not an image is in focus involves the use of the power spectrum.  When an image is in focus, its power spectrum returns information about the frequency-domain characteristics of the image.  As the image becomes out of focus, high frequency features of the image will tend to become blurred and the cooresponding high frequency power spectrum characteristics will decrease in magnitude.

The following data sets were used to test this technique:


Computation of Power Spectrum

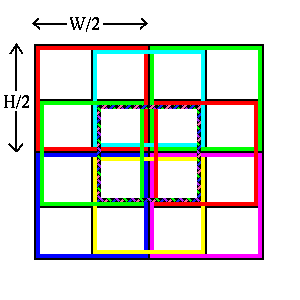
The power spectrum of images is approximated by the periodogram technique (see Peter D. Welch, "The Use of Fast Fourier Transform for the Estimation of Power Spectra: A Method Based on Time Averaging Over Short, Modified Periodograms", IEEE Transactions on Audio and Electroacoustics, June 1967).  In this method, the largest power of two number of pixels and number of lines are used to compute the periodogram.  For instance, if an image is 1280x1024 in size, the first 1024x1024 pixels will be analyzed.  If the width to be analyzed is W and the height is H, the data will be split into nine overlapping regions of size (W/2)x(H/2), as shown in Figure 1.
 
 
periodogram_regions.gif
Figure 1 - Overlapping Regions Used for Computing Periodogram

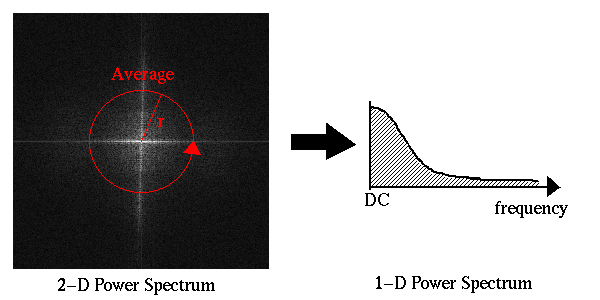
The magnitude squared of the Fourier Transform is then computed for each of the nine overlapping regions.  The approximated two-dimensional power spectrum is then obtained by averaging the magnitude squared output of each of the overlapping regions.  For the purposes of detecting focus, we are only interested in the magnitude of the power spectrum at high frequencies.  We do not care about the orientations of various features in the power spectrum.  For this reason, to simplify the problem the two-dimensional power spectrum can be reduced to one dimension by performing radial averaging, as shown in Figure 2.
 

radialavg.gif
Figure 2 - Radial Averaging of 2-D Power Spectrum


Normalization of Power Spectrum Data

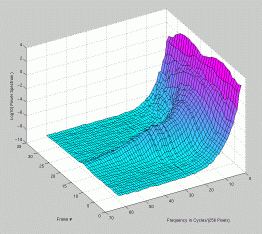
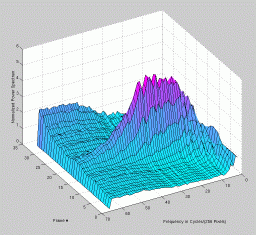
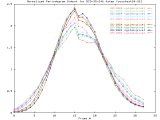
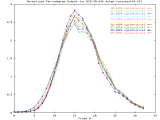
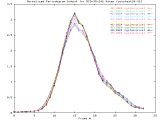
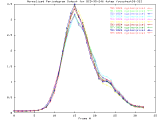
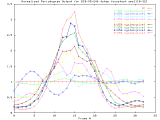
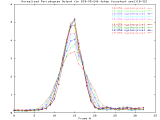
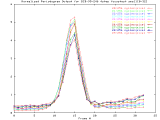
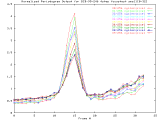
In order to test the correlation between image focus and power spectrum characteristics, a series of images were captured at different focus settings.  Power spectra were computed for each image for comparison.  In order to normalize the power specrum from each image in order to simplify comparisons, two pre-processing steps were applied to the data:  
 
radialavg.gif
(a) Original Power Spectrum 
with 1/256 and 2/256
frequency content removed
and plotted as log10 of output.
(b) Normalized Power Spectrum


Figure 3 - Normalization of Power Spectrum Data
 

Focus Experiments


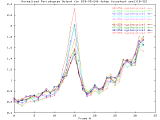
1024x1024 Image at 4 focus step intervals:


MVR-3041_4step Full Size - 

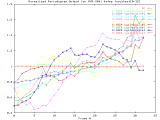
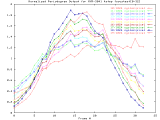
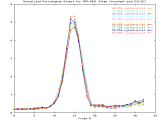
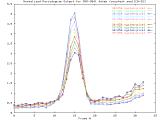
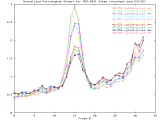
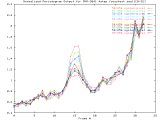
Set of 33 1024x1024 images taken from a typical (tree type ??) sample.  The images were captured at 4 focus motor step intervals, with frame 15 at the "best" visual focus.
  Sample images: frame10, frame15, frame20
DC - 9/1024 Cycles/Pixel
10/1024 - 19/1024 Cycles/Pixel
20/1024 - 29/1024 Cycles/Pixel
30/1024 - 39/1024 Cycles/Pixel
40/1024 - 49/1024 Cycles/Pixel
50/1024 - 59/1024 Cycles/Pixel
60/1024 - 69/1024 Cycles/Pixel
70/1024 - 79/1024 Cycles/Pixel


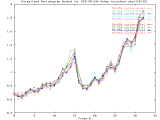
BCD-95-246_4step Full Size - 

Set of 33 1024x1024 images taken from a typical (tree type ??) sample.  The images were captured at 4 focus motor step intervals, with frame 15 at the "best" visual focus.
  Sample images: frame10, frame15, frame20
DC - 9/1024 Cycles/Pixel
10/1024 - 19/1024 Cycles/Pixel
20/1024 - 29/1024 Cycles/Pixel
30/1024 - 39/1024 Cycles/Pixel
40/1024 - 49/1024 Cycles/Pixel
50/1024 - 59/1024 Cycles/Pixel
60/1024 - 69/1024 Cycles/Pixel
70/1024 - 79/1024 Cycles/Pixel


256x256 Image at 4 focus step intervals:


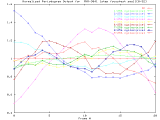
MVR-3041_4step Windowed - 

Set of 33 256x256 images taken from a typical (tree type ??) sample.  The images were captured at 4 focus motor step intervals, with frame 15 at the "best" visual focus.
  Sample images: frame10, frame15, frame20
DC - 9/256 Cycles/Pixel
10/256 - 19/256 Cycles/Pixel
20/256 - 29/256 Cycles/Pixel
30/256 - 39/256 Cycles/Pixel
40/256 - 49/256 Cycles/Pixel
50/256 - 59/256 Cycles/Pixel


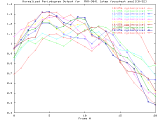
BCD-95-246_4step Windowed - 

Set of 33 256x256 images taken from a typical (tree type ??) sample.  The images were captured at 4 focus motor step intervals, with frame 15 at the "best" visual focus.
  Sample images: frame10, frame15, frame20
DC - 9/256 Cycles/Pixel
10/256 - 19/256 Cycles/Pixel
20/256 - 29/256 Cycles/Pixel
30/256 - 39/256 Cycles/Pixel
40/256 - 49/256 Cycles/Pixel
50/256 - 59/256 Cycles/Pixel


256x256 Image at 1 focus step intervals:


MVR-3041_1step Windowed - 

Set of 20 256x256 images taken from a typical (tree type ??) sample.  The images were captured at 1 focus motor step intervals, with frame 5 at the "best" visual focus.
  Sample images: frame0, frame5, frame20
DC - 9/256 Cycles/Pixel
10/256 - 19/256 Cycles/Pixel
20/256 - 29/256 Cycles/Pixel
30/256 - 39/256 Cycles/Pixel
40/256 - 49/256 Cycles/Pixel
50/256 - 59/256 Cycles/Pixel