Wed. May 4
Don’t forget on-line
course evaluation, available until Friday May 6 at https://tce.oirps.arizona.edu/TCEOnline
Final Exam Study
Guide will go up on D2L content and on course web page under “Final Exam
Guidelines” by Friday.
Current grades will
be posted at D2L by Thursday- please review them to make sure we have them
correct.
Our Final Exam
next Wednesday (May 11), 10:30am-12:30pm (room 308 Kuiper
Space Sciences), and it will probably be 100 M/C questions [if that changes, I’ll send out message to everyone].
NASA
video about the formation of Antarctic Ozone Hole
Stratospheric
ozone: Consequences- increased UV-B reaching surface (because less ozone is
present in stratosphere to absorb it) is of greatest concern for our health
(skin cancer, cataracts, premature aging, vitamin D), ability of decomposers to
operate and release nutrients as they break down organic matter, and health of
plants whose photosynthesis and growth may be reduced and damage to DNA
increased.
Review of GA6
results from the 12 groups and make-up group.
Note video and interactive play at “6
degrees could change the world” on National Geographic
Take home themes
from SL:
Earth’s long history is characterized by natural
climate change
current difference= rates & people
All else being equal/constant, an increase in Earth’s
greenhouse gases (which we definitively know is occurring) will result in an
increase in temperature feedbacks are important, but sometimes not well
understood
Solar energy is the bomb…………the H-bomb, that is solar
fusion is our source of “free” energy; it supports photosynthesis (CH2O and
O2); it drives weather; we can harvest its energy as bio-fuels, with wind
turbines, as hydroelectric power at dams, solar cells; its energy is available
to use in coal, oil and natural gas
CO2 and H2O…….the chemicals you can’t live without; both
greenhouse gases keep us comfortable; both necessary for life; both
photosynthesis reactants; H2O and heat exchange
Biomass ≈ Energy
biomass is a currency of energy that makes ecosystems run
Fossil-fuel emissions of CO2 are actually quite small
compared to Nature’s inputs of CO2 to the atmosphere. TRUE, BUT……………….. they
are not being all taken up by terrestrial and ocean sinks, so the CO2 levels in
the atmosphere are increasing rapidly
CO2 is not the only greenhouse gas contributing to
current atmospheric radiative forcing; CH4 and N2O
are next most important
Unintended consequences (cascading effects of
population and pollution)
problems of acid rain, tropospheric
ozone formation, stratospheric ozone destruction, enhanced greenhouse effect
were never part of the “global plan” (or even Dr. Evil’s scheme). Fossil-fuel use has resulted in the amazing
progress of the last 100 or so years and amazing technology of today, but
unintended consequences are the above problems (note: ozone hole depletion, is
largely from freon (CFC) production, a chemical
developed for its many useful characteristic to improve our lives)
Resources (metals and fossil fuels) are distributed
unevenly around the world because of the influence of plate tectonics and/or
past climates and vegetation; this means that often trade is needed even with
unfriendly political entities, worldwide demand may drive up prices, and we may
have to adjust our personal standard of living
Deforestation and greenhouse gas emissions in
Developing Countries are high, but these countries are not necessarily doing
things that Developed Countries have not done over the last 150 years to become
“developed”
Kyoto signers will lowering
GHG emissions except China/India
Trends will continue to rise (CO2, temp, sea levels)
even if GHG emissions ceiling is established (scary graph of predicted future CO2
concentration, temperature and sea-level rise that you have seen on a couple of
occasions)
Mother Nature undoubtedly still has plenty of
surprises in store for us- we don’t know it all! [See radiative
forcing above]
Are the high
global temperatures of the last decade the warmest temperatures ever on Earth?????
(NO! estimated to be 10 degrees higher in Cretaceous)
Mon. May 2
Today is Melanoma Day
As mentioned for
GA6, multitasking
may not work. In fact, the article says
that if you multi-task during this class, your are “more easily distracted and
less able to ignore irrelevant information” than others.
Q6 returned and
answers given (+4 pt quiz adjustment will be added to your raw score to a max
of 27 [the EC question on quiz was worth 2 points])
Course Evaluation
is now on-line (until May 6); you should have received e-mail notifications
with guidance linking to the evaluation site.
Acid rain often
[pH< ~5.2] can effect “cultural heritage”, materials such as metals/marble,
aquatic ecosystems, terrestrial systems.
Neutralization (“buffering") of acid rain in carbonate
terrain, whereas greatest negative impacts in granitic terrain such as the
Northeast and Canada.
Even if SO2
emissions were reduced, NOx would still be
emitted in large quantities across the US
(the highest in Texas and Cal.)
Prospects for
worldwide future emissions of NOx and SO2;
“cap and trade” program of 1995/2000 (establishing a “cap” or allowance for
emission from each source, then allowing the selling or trading of allowances
when a specific source is above or below its allowance), and its influence on
reducing SO2 emissions from utilities in the US. In 2003 an NOx Cap and Trade system was implemented by EPA
Stratospheric
ozone- the “good” ozone (O3) is very effective in absorbing incoming
UV; it is destroyed in reactions with Cl (freons, CFC)
A strong decrease
in stratospheric ozone concentration above Antarctica has occurred since the
late 1970s; large increase in extent of ozone depletion above Antarctica- this
is “ozone hole”
(unrelated to global warming); increased UV-B reaching surface (because less
ozone is available in stratosphere to absorb it)
Montreal Protocol
in 1987 to stop manufacture and trade of CFCs and other chlorine-containing
compounds; we hope to soon see the ozone hole area start to decline in the very
near future (but unfortunately some of the largest areas of the ozone hole have
been in the first decade of the 21st Century). The projection is that by 2070, ozone levels
above Antarctica will recover to their 1980 levels.
Fri. Apr. 29
GA6, what would you do?
Wed. Apr. 27
Term Paper was
handed back.
Looked at scary
figure (Fig.
5-2 if IPCC 2001 Synthesis Report) of projections of CO2 emissions and
concentrations for hundreds of years into the future and the corresponding
changes in temperature, even if emissions are reduced by the middle of the
century.
Further
consideration of the bet between the Ecologist and the Economist, with respect
to cycles of prices driving the results, or maybe the production and problems
associated with wastes not being fully included in prices, so they are not
rising as fast they would if more waste countermeasures were used.
American Lung
Association released its “State
of the Air”2011 report today. It
gives a list of top 10 cities with high ozone and high particulate
emissions. Despite improvements in air
quality attributable to the Clean Air Act, about half of the counties in the US
suffer from poor air quality and unhealthy ozone levels
Photochemical
smog: formed naturally during lightning discharges; formed largely artificially
in presence of nitrogen oxides, VOCs and sunlight; more likely to be formed in
winter in large northern cities, but plenty of sunlight in cities such as LA,
Phoenix and Mexico City to form ozone throughout the year; reduction of urban
ozone possible by reducing concentrations of reactants, especially VOCs and
nitrogen oxides many fuel pumps now designed to reduce loss of fuel vapors
Auto emissions usually check for
particulates, unburned hydrocarbons (“HC” or VOCs), and CO; catalytic
converters on automobiles are designed to convert CO to CO2, VOCs to
H2O and CO2, and NOx
to N2; strong oxidizing capacity of ozone can affect respiratory
system, degrade chlorophyll in plants, break down rubber products (tires,
seals, belts, electrical cords)
Despite the best intent of “The solution to
pollution is dilution”, a build-up of air pollutants is favored by very stable
atmospheric conditions (reducing vertical movement) associated with temperature inversions
Natural sources exist for emission of
nitrogen oxide, sulfur oxide, VOCs (such as terpenes/isoprenes from plants)
and even ozone itself (lightning).
Trees and pollution
Acid rain (more properly “acid precipitation” or “acid
deposition”)
pH
scale; acid rain often defined when pH<5-5.2. The pH when background atmospheric CO2 dissolves
to form weak carbonic acid is about 5.6 (much more acid than neutral pH of 7),
and sometimes other natural acids including organic acids can make the pH a
little lower; thus rain from “clean” areas is slightly acidic)
The eastern U.S. has the lowest pH of
precipitation (highest acidity) because of numerous sources of NOx and particularly SO2 gases to the
atmosphere.
Mon. Apr. 25
Class discussion
about CO2 being a pollutant (as a Supreme
Court ruling in 2007 had given EPA the authorization to do, and EPA announced
an emissions monitoring program in mid-March 2009). Class came up with several
points for and against CO2 as a pollutant, and in the end the class voted
about 40 to 6 in favor of CO2 being a pollutant.
News release on residential and commercial buildings and GHG
emissions and EPAs
competition for buildings and UNC
dormitory winner.
Population and
Waste- Cascading effects of gas emissions
American Lung Associations “State of the Air” report; in some
California cities air pollution is going up, but in many large US urban areas
air pollution is going down.
Waste may have ecological and health costs,
but historically dirty air is sometimes viewed as evidence of “success”
Primary
pollutants (directly out of the smokestack or tailpipe): such as VOCs
(volatile organic compounds), nitrogen oxides, sulfur oxides, carbon monoxide
(CO) and particulates; Sources dominated by transportation, power generation,
industry [all primary pollutants derive from the fuel (for example coal can
contain lots of sulfur), except for nitrogen oxides whose nitrogen derives
primarily from air N2]
Secondary pollutants like sulfuric acid,
nitric acid, ozone are produced by transformations of
primary pollutants SO2, NOx, and NOx+HC,
respectively.
Outcome of GA5,
the bet between the Ecologist and Economist: Out of the 27 subgroup outcomes
(12 regular groups with subgroups plus 3 subgroups in make-up, [only 3 because
2 subgroups of one of the make-ups had same set of 5 commodities]), the
Economist won 26 times by an average of $484 in 1990 and $549 in 2000. Why and
will this result continue? The
commodities are actually less scarce?
Fossil fuels have provided a very cheap “gift” source of energy to keep
production costs low, when other sources are typically much higher? Price fluctuates up and down quite
frequently, and perhaps based on random chance 1980 prices were high but 1990
and 2000 prices were low? Maybe some
environmental costs of waste (negatively affecting human health and ecosystems)
produced from production of the commodities may not be accounted for?
Fri. Apr. 22
Population and Resources: Water
Clip from Al Gore
that you had previously seen
The demise of
Lake Chad illustrates how climate change (regional drying) can be important in
the face of the demands of a large, growing population (“Lake Chad has been the
source of water for massive irrigation projects. In addition, the region has
suffered from an increasingly dry climate, experiencing a significant decline
in rainfall since the early 1960's.”- NOAA)
The catastrophic
effects of water diversion in the Aral Sea, west-central Asia
Massive water
collection and distribution network in California
and the Salton Sea near us, which has similar
problems
Eutrophication- after flourishing growth by addition of
excess nutrients to the aquatic system, dieback of the plants/algae results in
large demand on oxygen to decompose them, thereby reducing oxygen concentration
in water, which is particularly critical for higher organisms in food chain.
“Point sources” vs. “non-point sources of pollution” [Mackenzie Fig. 11.17]
Population and waste: GHGs
Sanitary landfill
(garbage dump) image
with methane collection system
Radiative forcing- our understanding is “very high” that
contributions to global warming by greenhouse gases have been important (about
2.5 W/m2, versus average total insolation
of 340 W/m2), with the order of importance= CO2 > CH4
> N2O and halocarbons (such as Freon).
Radiative forcing by greenhouse gases- our understanding is
“very high” that contributions to global warming by greenhouse gases have been
important associated with inputs of CO2, CH4, and N2O. The “Global Warming Potential” (GWP) of
methane (CH4) is about 20 times that of CO2 and the GWP
of N2O is about 300 times that of CO2.
Anthropogenic sources of
CO2:
industry, autos, land-use change/deforestation, wildfires and biomass burning
N2O:
industry, autos, feedlots, fertilizers, wildfires and biomass burning
CH4:
rice paddies, cattle, natural gas from wells and distribution system, natural
gas from coal mines and landfills, wildfires and biomass burning.
Is CO2 a pollutant? The Supreme
Court ruling in 2007 gave EPA the authorization to regulate CO2, and EPA announced
an emissions monitoring program in mid-March 2009). The Clean Air Act's defines "air
pollutant" as emissions (1) that cause or contribute to air pollution,
which may reasonably be anticipated to endanger public health or welfare; and
(2) that are emitted from numerous or diverse mobile or stationary
sources. You will provide ideas about
this on Monday
Wed. Apr. 20
Quiz 5 handed
back (2.25 quiz adjust points will be added to grade recorded in gradesheet)
Changes in
erosion related to land-use change (example the Washington DC area, forest to
agriculture to abandoned field to construction/urbanization)
Other Soil Degradation (besides water and wind erosion
[Mackenzie Fig. 11.3])
1. Physical
(2-3%) excessive compaction, waterlogging)
2. Chemical
(12%) salt build-up; stripping of nutrients; excess fertilizers;
pesticides/herbicides; wet/dry deposition (acid); industrial wastes/spills
Anthropogenic
causes of soil degradation- overgrazing, deforestation, agricultural practices,
fuelwood gathering, industrial & waste pollutants
(on a global basis, overgrazing, deforestation and agricultural practices
dominate soil degradation [Mackenzie Fig. 11.7], affecting about 17% of arable
land [Mackenzie Fig. 11.2])
Greenhouse gas
emissions from livestock about 18% of greenhouse gas
emissions, and it is related to Land-use change, Water, Feed, Ruminant
digestion, Solid & liquid waste, Transportation (HSUS
full report). Agriculture-related
greenhouse emissions would be related to some of these processes as well.
The “Green
Revolution” began mainly around the mid-1900s, and has greatly increased
agricultural production in the face of rising population (and even diminishing
cropland) by: mechanization, pesticides, herbicides, irrigation, new crop
strains (breeding and now genetic engineering), and fertilizers. The billion dollar question is whether it can
be sustained and adopted by poorer and developing countries (because of cost of
fertilizers and pesticides, soil degradation, continued loss of farmland, loss
of water for irrigation, and loss of genetic variability/variety). Also, has not worked as well with tropical
agriculture as with temperate agriculture in Europe and N.
America.
Epic trailer of sizzling new movie starring Sir Biff Wellington
about soil erosion catastrophe- Coming soon!
I smell Academy Awards and tens of questions about it on the next quiz.
Mon. Apr. 18
Quiz 5 first 20
minutes
Reading of
portions of Father Pernin’s first-hand
account of the fire catastrophe at Peshtigo
Soils are
composed of layers known as "horizons" [Mackenzie
Fig. 11.1]: A horizon tends to be organic-rich and materials tend to be leached
from this horizon downward; B horizon tends to accumulate materials leached
downward, including clays and iron oxide, and in western US carbonate ("caliche") accumulates in this horizon; C horizon is
partially weathered horizon below B; western soils have low acidity (they are
alkaline) and permit accumulation of carbonates related to evaporation
exceeding rainfall, but eastern soils tend to be acidic with no carbonates
related to rainfall exceeding evaporation.
Soil
characteristics: [a] soil grain size important to working soils, water and
nutrients; “loam”-type soils with a mixture of clays, sand, and silt tend to be
a better quality soils for crops; [b] type of clays present and cation-exchange capacity important to nutrition
Soil Degradation
Consequences: A- loss of fertile soil
(reduced production; more runoff; less water storage in soils; soil harder to
till; loss of soil carbon B- impacts on
surface water (higher flood levels; reservoirs can fill in with sediments;
turbidity (muddiness) can impact aquatic life)
Wind erosion can abrade leaves and expose roots
Fri. Apr. 15
GA5 Ecologist and
Economist gambling on the future (Make-up 1= Wed. April 20, 11 am, room 330
Space Sciences; Make-up 2= Wed. April 20, 1 pm, room 330 Space Sciences)
Wed. Apr. 13
Term paper handed
in.
Tropical forest deforestation
carbon inputs to atmosphere compared to fossil fuels and to non-tropical
deforestation over the past 150 years, and projections for future (Mackenzie
Fig. 10.17)
Deforestation in U.S. in 1800s; Forest was considered
inexhaustible resource by settlers and commercial interests moving eastward
from East Coast from early 1800s to Minnesota
in late 1800s.
Deforestation in
U.S.- Great Lakes forest fires of Oct. 8-11,
1871. Forest was considered
inexhaustible resource by settlers and commercial interests moving eastward
from East Coast from early 1800s to Minnesota
in late 1800s. Combination of unusually
dry climate, common occurrence of fires and sudden extremely windy conditions
resulted in forest fires that burned over 2 million hectares, killing over 1200
people in Wisconsin (Peshtigo-Williamsville)
and hundreds more in Michigan (same dates as Great Chicago Fire).
Deforestation was
associated with European settlement. After land was logged, slash was left
behind. When drought came to the area, what was left behind caught fire and
burned what trees were left, and degraded the soil. Both
forest, soil, and human resources were lost. To a large extent, the
areas that were logged and burned are now forested. This occurred though both afforestation and reforestation. These vigorous, young
trees took a lot of carbon out of the atmosphere, and stored the carbon in
wood, contributing to the net carbon uptake of US forests since about 1940 in
the figure showing history of net carbon uptake from atmosphere or net carbon
release to atmosphere from forested areas around the world (Mann/Kump p. 175). This
forest regrowth appears to be a major contributor to
a sink for some of the excess carbon (i.e., it is part of the missing carbon
sink).
Population and Resources: Soils
Historical and
ancient historical observations of water/soil perturbations- Attica (Greece)
deforestation and grazing 2000 years ago; salinity impacts on agriculture in
Mesopotamia and Upper Nile civilizations thousands of years ago; Aswan Dam in
1900s; salinity problems in 1900s in Iraq, Iran, Pakistan, Peru, Argentina;
dust from Sahel and Mongolia transported thousands of miles
Soil Degradation
[Worldwide Mackenzie Fig. 11.17]
Soil Erosion (57% by water, 29% by
wind, Mackenzie Fig. 11.3) in US this erosion averages about 10 tons per
hectare
On-site and off-site costs of
erosion in US might be $44B annually ($400B for whole world)
Natural events impacting soils= floods, landslides,
glaciers, wind, subsidence, drought, waves
Anthropogenic
activities impacting soils= mining, agriculture, logging, dams, transportation,
subsidence,wells
Mon. Apr. 11
First forests in
Devonian (about 400 my ago), but perhaps largest past forests were 300-350 my
ago [Carboniferous], 40-100 my ago [Cretaceous], evidence of which is found in
coal beds (eastern US coal is mainly carboniferous in age and high
sulfur). Although many of the tree
species in the Earth’s early forests not longer exist, some descendants
persist, many of which are diminutive in size.
Climate can
affect type and distribution of forests, (for example “in the last 150,000
years there has been about 10°C change in temperature from interglacial periods
135,000 years ago [and now] versus conditions during the cold glacial “maximum”
at 20,000 years ago). The ice age glacial maximum 20,000 years ago resulted in
shifting of forest southward in N. America and Europe,
and back northward over the past 20,000 years
Modern forests-
4-5 billion hectares world-wide, estimates vary depending on definitions of
forests and woodlands
Land-use changes
(urbanization; conversion of land to grazing, agriculture; dedication of land
to transportation [roads] or energy-flooding-resource concerns
[dams/reservoirs])
Major mechanism of land-use change is deforestation
Reasons for
deforestation: debt repayment (some woods are a very valuable commodity);
resettlement (the only land available to poor may be forested areas that they
must work by hand to own); conversion of forest to pasture; international
logging; hydropower (impounding water behind dam can inundate forests); fuelwood (cooking and heating)
Dramatic change in global
forest cover over the last 8,000 years, with removal of tropical forests
especially notable in the old world (paleotropics)
40-50% of
tropical forests (S. America, Asia, Africa) have been cut in last 200 years, ie, very rapid deforestation using “slash and burn” methods
(India, Indonesia, Brazil have greatest deforestation); tropical forests may
have distinct wet/dry seasons related to the position of the ITCZ
Tropical forests
(India, Indonesia, Brazil have greatest deforestation, i.e., they are greatest
“producers” of tropical wood; Japan, USA and Singapore and now China are
biggest importers of tropical wood); tropical forest characterized by
great biodiversity, including diversity with height; a genetic “storehouse”
possibly containing many new compounds that could become cures and treatments
for our illnesses and ailments (“Tropical Pharmacy”); about 30% of all
terrestrial NPP; contains 1/3 of all carbon in terrestrial biomass, but soils
only contain a small fraction (4%) of all carbon in soils world-wide; [from MacKenzie text: very tight nutrient cycling and retention
promoted by mutualistic fungi, dense canopy that
inhibits erosion, leguminous (N-fixing) trees]
Fri. Apr. 8
Quiz 4 was handed
back
“Rule of 70”= you
can determine how long it will take to double by dividing the annual rate of
increase into 70. For example, a city
whose population is increasing 7% per year will double its population in 10
years (70/7 = 10)
Hypothetical
population growth curve stages=> 1. lag, 2. exponential, 3. stationary, 4. death- we are in exponential phase transitioning to
stationary over the 21st Century.
World population may eventually top out around 8-10
billion people.
“Carrying capacity”= optimum population
that can be sustained in a system/area, and depends on 1-natural
resources (incl. food), 2-energy, 3-waste,
4-interactions)
Population
density (number of people per unit area; map)
is greatest in Japan, Asia and Europe; lowest in Australia.
Population (highest in Asia; world
population map) and rates of growth on different continents (highest in S.
America Asia and Africa).
Characteristics of populations (these can influence the trajectory of population
change): 1-birth rate, 2-death
rate, 3-sex ratio, 4-age distribution
of populations (age distribution or “population pyramids”-[tutorial]), 5-dispersal
(emigration, immigration)
(World Population Prospects, see the 2008
Revision executive summary)
Population and Resources: Forests
Mann/Kump figure of 21st Century deforestation (p.
175)
Wed. Apr. 6
Phenology used with European grape harvests to estimate
growing season temperature over the last 500 years. It has a “hockey stick”
shape, with the harvest date getting gradually later and later over most of the
period, and then getting earlier on average in the last hundred years.
CO2 emissions
from fossil fuels have increased since the beginning of the “Industrial
Revolution” around 1800, but only 55-60% of the emissions are represented in
the atmospheric CO2 concentration. So
where is the rest of the carbon going????
The “missing
sink” problem (maybe better called the “unidentified sink(s)” problem)
as of early 1990s=> about 6-6.5 GtC are going into
atmosphere from fossil fuels per year + another 1.5-2 GtC
from land-use change (largely Amazon deforestation) =7.5-8 GtC
total; HOWEVER, we can only account for
sinks for this excess carbon of about 3.5 GtC in the
atmosphere (about 50-60% of the fossil-fuel carbon release) + 2.2 GtC in oceans by inorganic dissolution=5.7GtC. So where is the rest of the carbon (1.3-2.3 GtC) going, ie, what is the
"missing sink"?
So where is the
rest of the carbon (1.3-2.3 GtC) going, i.e., what is
the "missing (unidentified) sink"? answer-
probably temperate ecosystems (mid-latitude forests including soils) and
tropical ecosystems (forests), with re-growth being a major component of these
sinks.
Volcanic inputs
of C to atmosphere are large (about 1/10th of a billion tons), but
quite small compared to human (fossil fuel and land-use change) inputs.
Combustion of
fossil fuels also affects other element cycles (not just the carbon cycle). An
imbalance in the N cycle from anthropogenic activities related to fossil-fuel
burning (N2 burned to NOx) and manufacture
of fertilizers from atmospheric Nitrogen.
Furthermore, the release of NOx and SO2 gases
from fossil-fuel combustion contributes to other world-wide problems such as
acid rain (maybe the SO2 emissions from fossil-fuel combustion have also been
counteracting the enhanced greenhouse effect, at least up until now)
Coal-oil-natural
gas geographic landscape (Mackenzie), N. America has lots of coal and natural
gas, but limited petroleum compared to other global regions. The Middle East
has relatively little natural gas and coal, but it has most of the oil.
Reserves (Fig. 3 of TecEco web home) of coal, oil and natural gas are
enough to sustain us well into future, but their distribution is variable, for
example US has large reserves of coal and natural gas, but not oil. Reserves of
coal and oil would last about 150 years at current rate of usage [but would
potentially triple atmospheric CO2 concentration]. Additional potential fossil-fuel resources as
tar sands, oil shales, and methane hydrates could
more than double the energy the potential energy compared to coal, but they
would also cumulatively increase atmospheric CO2 concentration 4 or 5 times]
Heavy U.S.
dependence in 2000 on fossil fuels for energy (about 90%), with only about 10%
for alternative fuels (nuclear and renewable); by 2009 it looks like the
nuclear and renewable has grown to about 15%.
“Peak Oil 1” [part 2], M. King
Hubbert and the possibility that global oil
production has/will peaked/peak sometime between 2005 and 2030, and possible
consequences.
Population
Thomas Malthus
hypothesis of world population
growth dating back to the early 1800s - world population will increase
disastrously unless checked by war, famine and disease, or “moral restraint”.
“Compounding”=
building up of something on the basis of its rate of growth; for example, in a
bank account money can earn interest at some annual rate by compounding.
Mon. Apr. 4
Quiz 4 at
beginning of period
Carbon cycle
box model diagram and primary forms of carbon [atmosphere= CO2, CO,
CH4, also CO; ocean= HCO3-, CO3-, dissolved CO2;
biosphere= CH2O; lithosphere= limestone (CaCO3) and kerogen (oil, coal, and finely dispersed organic matter)]
Imbalance of Carbon cycle
related to energy production (for transportation, heating, agriculture and
other needs of modern society) and consequent rapid transfer of carbon from the
lithosphere (where it has been isolated millions of years) to the atmosphere
Fossil-fuel CO2
release has exponentially increased from less than 0.1 gigatons
C (0.1 gigaton [Gt]= 0.1 billion tons = 1015 g carbon) 150-200 years
ago to approaching 8 gigatons C per year of carbon
today [8 Gt C= 8 billion tons C= 8 x 10⁹
tons C)]. This CO2 comes from oil, coal, natural gas, “flaring”
and cement
manufacture.
CO2 emissions by country- U.S. was
number one, but China is now number one.
Atmospheric CO2. The rate of increase has
been variable over the time period of direct measurement since 1958, related to
sources and sinks. Analysis of gas in
ice cores tells us the pre-Industrial Revolution concentration of CO2
was about 270-280 ppm.
Over last
eight-hundred thousand years there is a cyclic rise and fall of CO2
concentrations from about 190ppm at the peak of the glacial periods to about
275 ppm during “interglacial” periods. Current
concentration is the highest it has been in the last million years.
Past CO2
from carbon cycle models and analysis of leaf fossils and soil minerals (is the
392 ppm CO2 today the highest in Earth
history?)
Last 600 million years=>
evidence that most of the period had CO2 concentrations from about 5
to as many as 18 times the current CO2 concentration (corresponding
“ice house” and “hot house periods”).
Analysis of the
statement “fossil-fuel emissions of CO2
are actually quite small compared to Nature’s inputs of CO2 to the atmosphere,
and therefore we need not be concerned with them” in light of the carbon
cycle. It does not tell the important part of the cycle, ie
carbon formed slowly and stored for tens of millions of years is being rapidly
being added to atmosphere; we see large atmospheric concentration increase,
because the normal carbon sinks are not sufficiently fast to capture it all.
These emissions
have increased since the beginning of the “Industrial Revolution” around 1800,
but only 55-60% of the emissions are represented in the atmospheric CO2
concentration. So where is the rest of
the carbon going????
Fri. Apr. 1
GA4 on greenhouse gases
Wed. Mar. 30
Student Conservation
Association and opportunities for internships in
summer or other parts of the year.
Biosphere and carbon cycle
Atmospheric CO2. Direct CO2
measurements (“the
most important graph of the 20th Century”), beginning with Keeling’s measurement site established in Mauna Loa,
Hawaii, and providing continuous measurements since 1958; now a world-wide
network. Current CO2 concentration is almost 389 ppm
(part per million)- about 33% increase since 1958 resulting
largely from fossil-fuel inputs.
Increase in
atmospheric CO2 concentration has not occurred as a smooth line, but
like the teeth of a saw blade, with a maximum and minimum concentration each
year. Varying dominance of
photosynthesis vs. respiration causes it.
This annual “amplitude” (maximum CO2 to minimum CO2)
change is greatest at high latitudes in N. Hemisphere (“seasonal biosphere”).
Why is the amplitude low at the Equator and in most of the S. Hemisphere? (lots of terrestrial biosphere at Equator, but it is not
seasonal; little terrestrial biosphere at higher latitudes of S. Hemisphere)
Al Gore clip on
the causes of seasonal high and low CO2 (the “zig-zag”
ups-and-downs in the Keeling Mauna Loa CO2 curve)
Change of
Seasons- seasons may be shifting and expanding as a result of global warming.
Phenology is the
study of timing of recurring biologic phases such as budbreak,
flowering, first leaf unfolding, leaf fall, migration, hibernation, emergence,
and breeding.
Phenology can be
linked to carbon and water cycling and energy of biosystems.
Lilacs in US appear to be flowering
about 3-4 days earlier now than the first half of the 20th
Century.
A US Phenology network is coordinating and tabulating this
information for several species, and other networks exist outside the US.
Climate change and human health- WHO
estimates 150,000 excess deaths worldwide related to climate change (from
cardiovascular mortality and respiratory illnesses during heatwaves,
to altered transmission of infectious diseases and malnutrition from crop
failures, to flooding events). Disease
spread may be accelerated by warming (like malaria northward), but diseases
might sometimes be reduced (like malaria tropical areas that experience reduced
precipitation/drying)
IPCC and our
knowledge of radiative forcing, as relevant to GA4, which concerns GHGs
CO2, CH4 and N2O (and whether the ozone hole contributes to global warming or
cooling)
We looked at
carbon cycle depiction in Mann/Kump, including reservoirs/pools/compartments=places
where element/compound resides (biosphere, atmosphere, oceans, lithosphere),
and flux/flow/transfer=processes and
rates of movement between reservoirs (other C-cycle representations at Carbon cycle)
Mon. Mar. 28
Writing Exercise
#3 was handed in.
For Friday’s GA4
preparation, read EPA pamphlet available in D2L content for week of March
28. Friday, you will also bring in your
written scheme for reducing GHG emissions (see GA4 preparation instructions in
D2L) and particularly note in the table of the EPA pamphlet the various
activities responsible for large inputs of CO2, N2O and
CH4
Extinctions
Modern systems
have the greatest abundance of species
(especially insects) ever, but extinction rates seem to be high. Massive extinctions have occurred in the
past, unrelated to human activity. Permian-Triassic extinction event (225 million years
ago) the largest of the 6 major extinction in the Phanerozoic
(last 600 million years), plus extinction of megafauna
about 12,000 years ago, and possible major
extinction event in progress over the last 500 years (and growing).
Extinction of
dinosaurs (65 million years ago) might have been caused by meteorite impact,
evidenced by iridium “anomalies” occurring in sedimentary rocks around the
world of that age.
At the
Permian-Triassic boundary, evidence
from geological record suggests the possibility the extinction was driven by
large volcanic eruptions (Siberian traps) or meteorite/comet impact. Evidence suggests loss of land plants and
lots of sediments, and many "Bucky
Balls" (fullerenes) containing inert gases whose isotopic composition
suggests extraterrestrial origin.
Invasive species
come from different locations, in many cases different continents, moving via a
worldwide network of air and especially sea transportation. Invasive species in US may be responsible for
over $100 billion in losses each year.
Examples:
Buffelgrass (from Africa, introduced to US in the 1940s; it
is a C4
grass meaning it is better adapted to warm summer conditions) and cheatgrass (from Eurasia about 100 years ago; a C3
grass meaning it is better adapted to cool season conditions) a big problem
in western states because they capture water and nutrients that would otherwise
be used by the native plants. Both
grasses also promote wildfire, the consequence of which may be the death of
native trees and bushes, and the continued expansion of these grasses. Warming may help buffelgrass
to expand because it is better adapted to warm temperatures, and rising
atmospheric CO2 may provide cheatgrass a
further competitive advantage.
Zebra mussel were
introduced into the Great Lakes from ship ballast in the 1980s, and are now
spread throughout the Great Lakes and other nearby river systems including the
Mississippi River. ZM’s are prolific
filter feeders and filter fine organisms and particles out of the water, which
removes the food for some fish species.
Also, they encrust pipe taking up water and boats. Climate warming is expected to help them
extend their range northward.
Invasive species are a 2-way street, with
many Great Lakes species getting into European lakes/seas, and many from outside
Africa now causing problems for systems throughout Africa
Fri. Mar. 25
Distribution of
organic matter (O.M.) in biomes between the living organisms (mainly plants)
and the dead organic matter of soils and litter (Figure
from lecture- same password as other password-protected readings) expressed as
“dry organic material”. Biomes are
typically different in terms of either total organic matter or distribution of
organic matter between living and dead O.M.
Global
maps (same password as other password-protected readings) of (1) sunlight,
water and temperature as influencing growth and productivity, (2) changes in
productivity from 1982-1999, and (3) IPCC model projections of vegetation
change by 2100.
Biomass
is mass of living organisms (= phytomass + zoomass, which is approximately equal to phytomass alone) (mass/volume; mass/area)
Primary
productivity is amount of plant matter produced [by photosynthesis] (per
area per time)
Gross
Primary Productivity (GPP) is total production
Net Primary
Production (NPP) = GPP-respiration losses
Biomass in oceans
is a miniscule 0.5% of the biomass on continents, but some estimates suggest
NPP in oceans is almost 1/2 of NPP on continents. Biomass is needed on continents to provide
support to reach light, and therefore the continental biomass is dominated by
structural components (CHO- carbohydrates).
Marine biomass does not need the structural components, tends to have a
higher ratio of proteins to carbohydrates, and have much shorter life spans
than terrestrial organisms
Net
primary productivity (NPP) = GPP(gross primary
productivity) – respiration loss
Respiration loss is about ½ GPP
Aquatic: open ocean- LOW to algal beds, reefs- HIGH
Terrestrial: desert- LOW to tropical rain forests-HIGH
and tropical wet lands-HIGH
Coral
reefs are like the “rain forests of the ocean” in terms of
productivity. They are damaged or
threatened by:
1) Hurricanes
2) Humans (excess nutrients,
dynamite fishing, aquarium tropical fish trade, overfishing of starfish
predators and algae and seaweed eating fish)
3) Change in environment (salinity,
clarity, pH, temperature)
The pH change could be toward increasing
acidity as more CO2 dissolves in the water (rising atmospheric CO2
concentrations)
The current dieback observed in coral
reefs may be a result of several factors, often hard to isolate. Coral reefs may be reduced/killed
by future warming of the ocean, but coral species are not equally susceptible
to the conditions forcing coral bleaching, so the relative abundance of coral
species may change and reefs may persist
Aquatic biomes exist in lakes, streams and
the ocean. In the ocean, biomes are
related to whether they are on the ocean bottom (benthic) or in the water
column (pelagic). High biological
productivity in upwelling areas and in “estuaries” where fresh water streams
encounter coastlines in embayments with highly
variable environments of salinity (higher salinity toward bottom and lower
salinity at top) and organism associated with tidal mixing and rates of stream
flow. Extremely important to commercial fishing.
Wed. Mar. 23
Term Project
outlines turned in at beginning of class
According to
Mackenzie text, biosystems
(ecosystems) are composed of both abiotic and biotic components
These biosystems can be altered by global climate change or other
influences/events. For example:
Change in species
(abundance or composition; pioneering, invasion and extinction)
Change timing of
species development or activity; loss of breeding habitat
Contribute to
emigration or adaptive response
Contribute to
catastrophic change- wildfire and frequency
Example of fish
called “bream”
in India,
which may be shifting time of spawning to counteract effects of warming waters.
Food chains and
food webs (“Energy Pyramid”= “trophic
level pyramid
”=
“biomass pyramid”= “ecological Pyramid”)
90%
loss of energy going from one trophic level to the next level above it
Energy
consequences of "eating low" on the food chain for
Western & Asian diets
Biosphere
"abiotic components"- climate, nutrients (eg, C,O,H,N,S,etc),
sunlight, water
A
closer look at abiotic factors of nutrients (eg, major nutrients C,O,H,N,S,P
and minor nutrients K, Ca, Fe, Mg- Table from MacKenzie) and climate
Abiotic
and biotic components comprise biosystems (ecosystems)
Large,
easily identified community units are known as "biomes"; interaction of biota and climate (Fig. 1.9) on a
regional scale. Biomes around the world, such as
grasslands (Fig. 4.8; table 4.3). These
biomes generally conform well to climate regions, where climat is similar (map)
Distribution
of organic matter (O.M.) in biomes between the living organisms (mainly plants)
and the dead organic matter of soils and litter (Figure from lecture [same password as
other password-protected readings]).
Biomes are typically different in terms of either total organic matter
or distribution of organic matter between
living and dead O.M.
Mon.
Mar. 21
Mid-term
exam was handed back and we
went over 2-3 M/C questions per exam page.
All answers are at D2L content for week of March 21. Prof. Leavitt made an error in his grading
key and the answer to question #43 should be D (not C); if graded incorrectly please
give to Prof. Leavitt or Rebecca to correct in gradesheet.
First
stage of writing project due
Wednesday at beginning of class period.
See D2L content week of Feb. 28 for instructions and D2L content week of
Mar. 21 for grading information
Writing
exercise 3 was handed out
today- due next Monday
Events
after the midterm
1)
Spring Equinox yesterday (March 20), day of year when sunlight comes in
vertically over the equator and we have 12 hours of day and 12 hours of night
2)
The Japanese earthquake (32km depth off coast of Sendai; Richter magnitude of
9.0; related to convergent plate boundary) and tsunami of Friday March 9.
Final
words on Sea Level:
One
of the IPCC robust findings is that sea level will continue to rise for many centuries,
even if GH gas emissions and GH gas concentrations are stabilized. Uncertainty as to how long Greenland will
take to melt; during last interglacial 125,000 years ago more of Greenland
melted and consequently sea level was over 3 m higher than today. Greenland ice sheet may melt to size of ice
sheet 125,000 years ago in several thousand years, although it may be
substantially sooner depending on ice dynamics.
Biosphere (also called “Ecosphere” in our text)
Contains "abiotic components"-
climate, nutrients (eg, C,O,H,N,S), sunlight, water
Contains "biotic components"-
trophic (nourishment) levels from bottom to top: (1)-primary
producers=autotrophs; (2)-primary consumers=herbivores (=heterotrophs);
(3)-secondary consumers=carnivores (also =heterotrophs) and additionally a
group (4)-decomposers. “Omnivores” may eat at more than one trophic level.
Fri.
Mar. 9
No
class- students worked on their term writing project
Wed.
Mar. 7
Q3
was handed back and discussed; WritingExercise 2 was handed back and
discussed.
Miderm
Exam, Wednesday, on material from beginning of the semester through today.
Study guide is on D2L under Content for week of March 7
Clip
from An Inconvenient Truth about ice melting and sea-level rise.
Sea
level rise seen at most coastal localities around the world; but not the exact same trends in rise (in
fact some show no increasing trend over the last 15 years).
Consequences
of sea-level rise
Increased
coastal flooding
Increased
coastal erosion
Loss
of coastal wetlands
Salt
water intrusion
Loss
of “developed” land
Displacement
of people (e.g., Tuvalu islands in SW Pacific now or Beijing/Shanghai/New York
in future)
A
1990’s estimate of the cost of a 1 meter sea-level rise in the U.S. was about
$400 billion.
The
recent and expected rise in sea level is believed to be a consequence primarily
of melting
of ice on land (glaciers/ice sheets) and expansion of (warming) ocean water (because it
decreases density at higher temperature)
Besides
global sea level change being dominantly influenced by warming of ocean and
melting of permanent ice on land (glaciers/ice sheets) for the neat past and
future, other effects on sea level are related to impoundment of rivers behind
dams (like Three Gorges Dam, China), or local effects that may be permanent
such as subsidence (like Venice) and tectonic changes (faults/earthquakes), or
temporary such as hurricanes.
IPCC
modeled prediction of global temperature changes of about 1.5 to 6°C by 2100
(2-4°C is most likely), and the mean estimate of global sea level rise is
expected to be about 40-50 cm. These
predictions represent modeling different scenarios related to fossil fuel
usage, economy, population, alternate fuels, etc. Mann/Kump show an estimate of sea level rise
of 80-90 cm (or about twice that of IPCC 2007), because models are now better
taking into account affects of ice dynamics, such as “calving” of ice sheets
into the ocean.
One
of the robust findings is that sea level will continue to rise for many
centuries, even if GH gas emissions and GH gas concentrations are stabilized.
Effects
of a 1 to 6 m sea-level rise at various places around the world can be viewed
at this link. [select a region and look at still
image for a particular increase in sea level, or run quick time movie by
selecting “view”, and then “loop” when it is loaded]
Fri.
Mar. 4
Quiz
3 first 20 minutes
“Northwest
Passage” was open in late 2007 because of melting of Arctic sea ice (“the
lowest area in history” but “history” only refers to the time since satellite
observations (began about 1980).
Since
1980, satellite evidence of decline in the area covered by sea ice in the Arctic (but
sea ice pattern in Antarctic does not show such a clear trend)
Ice Road Truckers. This Arctic commerce depends on frozen ground
(soil and lakes) over which they drive.
If the length of time that lakes and soils are frozen is slowly being
reduced, the consequence is reduced time available to transport goods by this
method.
Methane
hydrates (ice with cage-like openings in the molecular structure that hold
methane molecules) locked in permafrost and continental shelf marine (ocean)
sediments. They could provide fuel for
society if carefully managed, but they could contribute an uncontrolled release
of large quantities of potent greenhouse gas to the atmosphere as warming melts
the ice.
IPCC maps of Greenland and Antarctica
showing area where snow/ice is accumulating and where it is declining over the
last decade or two. Greenland seems to
have a net loss of ice, but the more isolated Antarctica may not be showing any
net change.
IPCC
prediction this century for loss of glaciers and ice caps (also contributing to
rising sea level), increases in thaw depths of permafrost regions, and
acceleration of warming in Arctic by “positive feedbacks”.
Feedbacks- positive feedbacks
reinforce a change or process that has already take place. For example, if
warming by CO2 is the initial process, then resulting increased
evaporation could lead to more water vapor in the atmosphere, which is a
greenhouse gas that could further amplify the initial warming; a negative
feedback counteracts (opposes) a change or process that has taken
place. For example, if warming by CO2 is the initial process, then
resulting increased evaporation could lead to more water vapor in the
atmosphere that could contribute to more clouds, which could reflect more
incoming sunlight, thereby decreasing temperature and counteracting the CO2
warming effect.
Summary
of Consequences of Arctic warming
Ice/snow Melting: reduces albedo, enhances
warming (this is positive feedback)
Melting of permafrost with
consequences to
structures and roads
methane release
Northwest Passage and commerce
Melting and contribution to rivers
flowing to Arctic Ocean [together with enhanced precipitation at high
latitudes], which could influence TH Circulation
Shifting
vegetation, tundra => forest (forest has lower albedo than tundra); longer
growing seasons
Warming, drying and forest fire
increase
Reduced
ice in the Arctic Ocean Fall 2007 prompted Russia planted a flag at the N. Pole to
claim its resources/territory.
Kilimanjaro
- iconic symbol, and representative of global environmental change and our
(humankind’s) badness to the planet, but maybe these stories aren’t as they
seem.
Wed.
Mar. 2
Fires
scars in tree rings were used to determine when fires occurred and the
climatology associated with fires in Southwest.
The first 2 in-class writing exercises relate to the correspondence of
low burned forest area to El Niño conditions and high burned forest fire area
to La Niña conditions.
Story
of rubber ducks- Items inadvertently thrown in ocean (for
example from container ships) helping to inform us about ocean circulation.
North Pacific “Garbage patch”. You can even go on a cruise this summer to see it!!!
(NPR Moby Duck)
Cryosphere
Videos
from Al Gore’s AIT topics on the melting mountain glaciers, Arctic and
Antarctic. Solar energy and albedo
changes were a big element related to the Arctic clip as related to “positive Feedbacks”- positive feedbacks
reinforce a change or process that has already take place. In the polar ice
example, warming by CO2 is the initial process, after which the
north pole ice cap (sea ice) shrink and albedo becomes lower (more sunlight
absorbed by Earth’s surface when the white ice/snow is lost, which in turn
leads to more heating of the poles. In
other words, the melting of the ice cap amplifies the initial warming- this is
a positive feedback.
“Northwest
Passage” was open in late 2007 because of melting of Arctic sea ice (“the
lowest area in history”), but headlines of being open for “for first time in
history” were misleading because it is based on satellite observations.
Permafrost-
permanently frozen ground. Often surface may thaw to shallow depth in summer
but deeper layer of permafrost will remain frozen all year. If melted, it caused numerous engineering
problems. The “drunken forest” in AIT
occurred where permafrost was melting; also the sinking of buildings, roads and
pipelines where permafrost is melted.
Mon.
Feb. 28,
Make-up
times for GA3:
Wed 2-2:50 (March 2)
Room 330 Space Sciences and Thursday
12:30-1:20 (March 3) Room 330 Space Sciences; Anyone who missed GA3 is welcome to
come to the make-up, regardless of whether you had a valid excuse or not.
Please estimate how many pound of beef you eat per week, and how many pound of
non-beef meat you eat per week and bring these numbers along with a CALCULATOR,
to the make-up. (full instructions under D2L content for week of Feb. 21) Don’t
be Late!!
Writing
Exercise 2 was handed in
Writing
project
(see D2L content for week of Feb. 28 or the syllabus) was unveiled, with lots
of possible topics given, as well as deadlines, requirements and formats. If you come up with a global environmental change
topic other than related those given in the instruction, you should pass it by
Prof. Leavitt or a TA to make sure it is ok.
Ocean
circulation- surface ocean current on the eastern side of the south Pacific
Ocean Basin (eastern current of the S. Pacific gyre) normally brings cool water
from the Antarctic northward. That
current promotes “Upwelling” of nutrient-rich deep water
along the S. American coast, which supports food chains/webs, which can in turn be
influenced by ocean/atmosphere conditions.
El
Niño and currents in S. Pacific
El
Niño tends to recur in irregularly from 2-7 years, and strength varies among
events.
It
is related to atmospheric and ocean circulation in the tropical Pacific Ocean
(see diagrams in textbook and http://www.pmel.noaa.gov/tao/elnino/nino-home.html)
Evidence
for El Niño events= (1) Thick, warm water pooled on east side of Pacific, (2)
Reduced upwelling off S. American coast and fishery crash, (3) SOI (Southern
Oscillation Index) negative (the atmospheric pressure at Darwin is greater than
Tahiti), (4) Westerly winds (west to east winds) in Pacific near equator, (5)
High precipitation in Ecuador/Peru; Low precipitation in Australia/Indonesia
During
La Niña events conditions are generally the opposite of those listed for El
Niño evidence. We are currently in a
fairly strong La Niña, with lower precipitation this winter in southern Arizona
than average (although maybe it is not warmer than average as we would expect)
“Teleconnections”
are the influence of El Niño outside of the confines of the Pacific Ocean
Basin; these include statistical correlations of El Niño with climate of
diverse locales such as climate effects in the US Southeast, eastern S. America
(including the Amazon Basin), India, and Africa; see teleconnection maps in Mackenzie and
Mann/Kump.
“ENSO” (El Niño/Southern Oscillation) and
tropical wildfire- during El Niño events, there is increased precipitation
along Peru and Ecuador (but precipitation is reduced in Amazon), so it is ripe
for fires just like the rainforests in Indonesia during El Niños (the opposite
occurs during La Niñas)
El
Niño has tended to be more frequent and stronger after the mid-1970s, whereas
La Niña tended to dominate in the decades prior, suggesting some decadal
periodicity; these cycles on longer scales (25-30 years) may influence Pacific
climate and teleconnect elsewhere, including PDO (Pacific Decadal Oscillation)
Consequences
of “El Niños of the Century” (1982-83 & 1997-98) in the western US, such as
flooding and filling of water reservoirs
IPCC
says warming will contribute to shift of warm pool to east in Pacific during
the 21st Century, but models do not agree about whether frequency
and strength of El Niños and La Niñas will change.
Fires
scars in tree rings were used to determine when fires occurred and the
climatology associated with fires in Southwest.
The first 2 writing exercises relate to the correspondence of low burned
forest area to El Niño conditions and high burned forest fire area to La Niña
conditions.
Fri.
Feb. 25
Group
Activity 3- beef
Wed.
Feb. 23
Writing
exercise 1 was handed back
Preparation
for GA3, see Feb. 21 ClassNotes
Densest
water forms in far North Atlantic and far South Atlantic areas of ocean, where
there are cold temperatures and salinity greater than 35permil (35 parts per
thousand=the average of ocean water)
The
excess salinity in N. Atlantic contributes to sinking of dense water that then
moves as a deep current through the S. Atlantic Ocean, Indian Ocean and Pacific
Ocean before rising and returning as a warm-water surface current back to the
N. Atlantic (to replace water that has sunk to the deep currents)
Thermohaline circulation transports heat and salinity (salt) as nature tries
to even out these imbalances around the world ocean.
There
may have been times in the past, and maybe in the future, where the
thermohaline circulation could slow or stop, with important climate
consequences. Younger Dryas was an abrupt return to cold
conditions about 12,000 years ago (10,000 radiocarbon years), after the last
ice age appeared to end; evidence is seen in calcium concentration of ice
cores; it was likely caused by a shift in meltwater discharge from the Gulf of
Mexico to the N. Atlantic as melting N. American glaciers retreated. It appears to have been teleconnected
world-wide, probably by its influence on suppressing thermohaline circulation. This is an example of “abrupt climate
change”
Story
of tree rings and Younger Dryas in central N. America from NW Indiana
Evidence
for freshening of N. Atlantic (from precipitation or melting ice) in recent
decades.
IPCC
report predicting a 25% slowdown of thermohaline circulation by the end of the
century, but no shutdown; beyond that it is uncertain.
Ocean
circulation, surface ocean
Surface
currents- driven by wind; flow in semicircular patterns known as
"gyres"; high pressure drives air circulation that drives gyres;
direction of circulation is different in the North and South hemispheres.
Also,
the surface warm return currents of thermohaline circulation such as the
Gulfstream move water at and near the surface. Gulf Stream provides mild
climate of British Isles and Scandinavia (compared to more extreme climate of
Virginia to Massachusetts where first European settlers arrived)
“Upwelling” of nutrient-rich deep water
along S. American coast supports food chains/webs (fisheries along coastal
Peru are dependent on upwelling); the food web is supported at its base by
photosynthesis (CO2 + H2O in the presence of chlorophyll
and with energy from sunlight => CH2O + O2). The CH2O product is organic matter
that is important both with respect to mass and stored energy. [Respiration,
combustion, and decomposition are mechanisms that represent the reverse
reaction: CO2+H2O => CH2O + O2]
Mon.
Feb. 21
Quiz
2 was handed back and answers were discussed (+1.5 quiz adjust will be added to
your raw score). “Tipping Point” was the
wrong answer to question 3, but it relates to one of your readings that we did
not cover in class. No one knew the
meaning of it, so we will have a question about it on Quiz 3.
Preparation
for this Friday’s GA3.
Estimate how much beef (or other meats) you eat per week, and bring calculator.
Also read short articles on beef nutrition fact sheet and Worldwatch
article “Is Meat Sustainable” (full preparation
instruction under content on “Week of Feb. 21”)
Section
52 students start a new Discussion today on weather extremes and variability.
Kepler
telescope devoted to finding planets around other stars
in our galaxy came out with an estimate a few days ago of perhaps 500 million
“goldilocks” planets in our galaxy.
Humidity
in the atmospheric reservoir of the water cycle- Warmer air can “hold” more
humidity- an increase in global temperature could result in more evaporation
and more water vapor in the atmosphere, but relative humidity would not
necessarily change because higher temps would mean more water-vapor holding
capacity. Try USA Today and USA Today2 for more explanation.
IPCC (Intergovernmental Panel on Climate
Change) 2007 report gives us information about past climate variability and
future changes. With global temperature
increase, the hydrologic cycle can be affected.
For example, heat waves/drought are expected to be more frequent and
last longer in the future, with some evidence of increased drought in the
tropics/subtropics. Precipitation will
change but not necessarily uniformly- in some places, more precipitation is
forecast and others less. Evidence of
reduced N. Hemisphere snow cover in the last 25 years
With
global temperature increase, the hydrologic cycle can be affected.
Precipitation will change but not necessarily uniformly- Maps showing
prediction of precipitation in 21st Century (see p. 89 of
Mann/Kump), Maps showing change (increase and decrease) in precipitation
during the 20th Century, and Maps showing change (increase and
decrease) in number of days of precipitation.
Even in some areas of increasing precipitation, the number of days of
precipitation has decreased, i.e., fewer precipitation events but they are
larger in quantity of precipitation.
Deep-ocean
currents (and the “Ocean Conveyor Belt”) require dense water to start cycle by
sinking
Dense
water achieved by (1) cooling or (2) increase in salinity
Short
Writing Exercise 2 was handed out toward the
end of the period (due next Monday). It
is related to writing more economically and more interestingly by
reducing usage of there is, there are, there will be, there were, etc.
Fri.
Feb. 18
Writing
exercise 1 turned in today
Demo
of surface tension of water with razor blade and paperclip.
Properties of water (<= click for diagrams) cont’d
More
salt and polar compounds can be dissolved in water at higher temperature, but
non-polar gases are less soluble in water at higher temperatures.
A
measure of the amount of material dissolved in water is TDS (total dissolved solids)- it ranges
from 0 parts per million (pure distilled water) to Tucson water (300-700 ppm),
to ocean water (35,000 ppm equivalent to 35ppt), to Dead Sea (200,000 ppm);
water quality may also depend on what is “in” the water (for example low TDS
but high arsenic or PCBs could be a problem that electrical conductivity alone
could not detect)
Pattern
of latitude precipitation- highest at equator, and secondary peaks at about
45-55° latitude; minima at about 30° and 90° latitude (related to solar heating
and general circulation) (diagram in Mackenzie)
General
pattern of evaporation with latitude- greatest at low latitudes and least at
high latitudes (diagram in Mackenzie)
Groundwater,
aquifers and subsurface flow of water in the water cycle
Streamflow
(runoff) can be measured with stream gage instruments back into the 20th
Century, but tree rings can be used to reconstruct streamflow
back hundreds of years.
Wed.
Feb. 16
Quiz
2 first 20 minutes
Still
waiting from group leaders of groups 2 and 12 to complete their GA2 assignment.
Writing
Exercise 1 due Friday- (1) Don’t use while,
if you mean although or whereas
(while has element of time); (2) Don’t use due to
if you mean because of or caused by; (3) Don’t use since if you mean because (since
has element of time); (4) that
is more specific to one thing just referenced in a sentence, whereas which encompasses broader ideas or a less specific reference
and is usually preceded by a comma. In
all formal writing for the remainder of the semester, you will lose credit for
each occurrence of one of these mistakes (less for that/which because it is
rather tricky sometimes).
Clip
from An Inconvenient Truth about disturbances of the Hydrologic Cycle, hence
the value in knowing something about it.
Properties of water (<= click for diagrams) cont’d
Specific heat- 1cal of heat energy will
raise temperature of 1 g of water 1°C.
Most other substances, eg, metals, sand, have lower specific heat.
As
water cools density increases to a maximum density at 4°C (39°F); with further
cooling density decreases- this contributes to lakes that freeze from the top
down in the winter (rather from the bottom up)
Water
can dissolve many different types of substance such as salts (like table salt),
polar compounds (like carbohydrates and proteins), and non-polar substance
(like CO2 and O2)
More
salt and polar compounds can be dissolved in water at higher temperature, but
non-polar gases are less soluble in water at higher temperatures.
Mon.
Feb. 14
GA2
Make-up- Tuesday 11am, room
104 W. Stadium (conference room); COUNTRY=
North Korea
We
considered Benford article related to “geoengineering” to reduce or prevent
harmful global warming effects from enhanced greenhouse effect. Students came
up with some of the ideas from article such as painting roofs white, adding SO2
(converted to sulfate SO4--) to troposphere and
stratosphere, the “geritol” solution of adding iron to the ocean, and planting
trees. One question on Quiz 2 will be
related to these or other ideas from Benford.
Climate
is weather averaged over time (usually about 30 years), and models forecasting
global change compare the average of at least 20-30 years of their forecast to
the current conditions for 20-30 years.
This is seen in modeled global temperature map comparing
predicted temperature change for 30 years at the end of the century to 30 years
at the end of the 20th Century.
Hydrological
cycle is expected to change associated with global climate changes, so some
areas may become wetter and others drier (see Mann and Kump, p. 124-125) (past “superdroughts” contributing to
downfall of Toltec and Aztec empires revealed by tree rings, indicating the
sensitivity of the Southwest and Mexico to drought, featured in Scientific American article)
Intro
to water cycle (driven by solar energy)- reservoirs
where water resides, represented by the amount [mass, volume] present), and fluxes
represented by movement of water between reservoirs [mass per time, volume per
time]) Most water in oceans, most fresh
water locked up in ice caps, more fresh water in groundwater than surface
water. Fluxes between water reservoirs,
eg, runoff is the primary direct flux between continents and ocean, or precipitation
transfers water from atmosphere to land or ocean.
Properties of water (also this link)
Strong
covalent bonds between hydrogen and oxygen (sharing of electrons to “fill”
electron shells/orbitals)
“Polar”
water molecule (which has a “positive” side and “negative” side) promotes cohesion,
adhesion, capillary rise (water pulls itself upward in small tubes
because of cohesion and adhesion), and surface tension
Handed
out writing exercise due on Friday Feb. 18 at class time:
(1)
Don’t use while, if you mean although
or whereas (while has element of time); (2) Don’t use due to if you mean because
of or caused by; (3) Don’t use since if you mean because
(since has element of time);
(4) that is more specific to
one thing just referenced in a sentence, whereas which encompasses broader ideas or a less specific reference
and is usually preceded by a comma.
Fri.
Feb. 11
GA
2 Water Resources around the world
Wed.
Feb. 9
Satellite
photos of storms and weather maps with High and Low Pressure systems and
fronts.
Earth’s
“radiation budget” (Mackenzie)- 30% of incoming solar radiation is reflected
immediately back to space ("albedo") by Earth's surface and
atmosphere; for the fate of the 70% absorbed: 45% is absorbed by the Earth’s
surface yet the Earth’s surface does not get warmer and warmer. This is because much of the energy absorbed
at the Earth’s surface gets transferred to the atmosphere by latent heat
(evaporation) and sensible heat (conduction of heat you feel) by
“thermals”. Greenhouse gases (GH gases)
absorb and re-radiate electromagnetic radiation, maintaining the warmth of the
Earth-atmosphere system. This radiation
budget relates to how the Earth was, is, or can be cooled or warmed.
Atmosphere
absorbs some wavelengths of terrestrial and solar radiation. Incoming solar radiation has much of its UV
radiation removed by oxygen and ozone; outgoing terrestrial radiation is
absorbed by greenhouse (GH) gases such as water vapor and CO2.
Our
detailed definition of the greenhouse effect- the atmosphere is “transparent” (ie, it
does not absorb) to much of the incoming solar radiation (like the greenhouse
windows), but greenhouse gases effectively absorb many wavelengths of the
outgoing terrestrial radiation and prevent the energy from escaping to space
(like greenhouse windows keeping heat energy in the greenhouse). Greenhouse gases, particularly water vapor (H2O)
and carbon dioxide (CO2) contribute to the “greenhouse
effect” that has maintained relatively mild temperatures on our
planet for billions of years. The “enhanced greenhouse effect” from rising
greenhouse gases like CO2 is the concern behind Al Gore’s AIT, the
National Geographic Special “6 degrees”, the Kyoto Protocol, etc. The garden-variety greenhouse effect
is a good thing that has served Earth well for billions of years, without which
the Earth’s average temperature would be 33ºC colder; it is the enhanced
greenhouse effect that is the major global change problem we are currently
facing.
“Enhanced greenhouse effect” is of
concern because very large recent increases of greenhouse gases such
as CO2, methane and N2O, all of which varied little between
10,000 years ago and about 200 years ago, but have since increased drastically
Weather- conditions in the atmosphere (temperature, humidity,
atmospheric pressure, winds) now or at some other specific time. (a weather map
depicts aspects of weather)
Climate- weather measured over several decades, usually at least 30
years. Average annual temperature of a
location, average temperature on Feb. 15 would be examples of climate measures,
deviation of current temperature from the long-term average would be a comparison with climate
The
assigned-reading article by Benford proposes some “adjustments” of our
atmosphere (and oceans) to counteract global warming. What are these adjustments? Make sure you
have read this by Monday.
Mon.
Feb. 7
Begin
preparation for GA2
We
discussed answers to homework exercise involving different temperature scales
and global atmospheric circulation associated
with convection cells in the atmosphere.
Intro
to general circulation based on homework exercise- Deserts, storms, surface
wind directions, horse latitudes, doldrums, and sailing to “New World”
Earth’s
“radiation budget”- 30% of incoming solar radiation is reflected immediately
back to space ("albedo
”) by Earth's surface and
atmosphere; for the fate of the 70% absorbed: 45% is absorbed by the Earth’s
surface yet the Earth’s surface does not get warmer and warmer.
High
and Low Pressure systems, and movement of air around them (clockwise and
counterclockwise in the N. Hemisphere, respectively).
Demonstration
of 4 atmospheric gases (N2, H2O, CO2 and O2),
some in unusual (cold) forms. Experiment
to determine if one of the liquids in the test tube was N2, H2O,
or O2. Experiment with
balloon and liquid nitrogen.
Fri.
Feb. 4
Incoming
solar radiation is most “concentrated” near equator, and most “dispersed” near
the poles because of the angle of incidence.
Transfer of energy by radiation, conduction and convection, all of which
relate to heating of Earth-Atmosphere system and transfer of excess heat from
ground to atmosphere and from low latitudes to high latitudes.
A
little more on general circulation (Hadley Cells, rising/sinking air, etc) in
regard to prevailing surface winds and their influence by the Coriolis effect (another link), which deflects wind to
right in N. Hemisphere and to left in S. Hemisphere
Electromagnetic
radiation is means by which energy is gained and lost by the Earth.
Electromagnetic
spectrum (pdf) subdivided into categories of
radiation defined by wavelength (l).
“Rules of Electromagnetic (EM) Radiation”-
(1) The hotter the object, the shorter the wavelength of peak radiation (Wien’s
Law determines the peak wavelength, and the temperature of any object will
determine the wavelength), (2) Shorter wavelengths have greater energy, (3) Energy emitted as EM radiation increases
as the 4th power of an objects temperature, (4) Objects emit visible
light (reddish glow) as objects reach a temperature of about 550-600C.
Wien’s
Law (lpeak=2880/TK)
determines the peak wavelength and at Earth’s temperature (15ºC, 288K) the peak
of emitted radiation is at 10mm
(infrared), whereas at Sun’s temperature (6000K) the peak of the emitted
radiation is at 0.5mm (visible).
Last
20 minutes= Informal contest to see which 1/3 of the class would be able to
save the polar bears (NON-Trivial Pursuit type of quiz game)
Wed.
Feb. 2
We
live in the bottom of a "sea" of air, with greatest atmospheric
pressure at the Earth's surface (at sea level)
Temperature structure of atmosphere--
averaged over the whole planet and over the whole year, we see temperature change
as we go upward into the atmosphere as follows:
Average
surface temperature is +15°C (Earth’s surface would be -18°C if no greenhouse
gases were present)
As
you go further upward, temperature decreases to about -57°C at a height of 10
km, which is the top of the lowest atmospheric layer (known as the
“troposphere”, in which we live)
“troposphere”
in which we live, contains nearly all weather on Earth, and has abundant
vertical and horizontal air motion (clouds indicate some of this vertical motion)
The
thin layer above the troposphere is called the tropopause where temperature
remains constant as you continue to go upward
As
you continue further upward, temperature then starts to warm in the next layer
(“stratosphere”, contains the ozone layer where absorption of solar
ultraviolet radiation contributes to the increasing temperature, and air
motion is dominantly horizontal) until it is a balmy 0°C at the top of the
stratosphere at 50 km
Record
of rising average global temperature since 1850 (from Kump/Mann) based on
instrumental measurements; photos of measurement of temperature- thermometers
in instrument shelters
Some
examples of poorly sited instrument shelters- IPCC 2007 report states that the
upward trend in instrument-based global temperatures occurs regardless whether
sites with urbanization are included or excluded from the mean global record.
Temperature
scales (°F, °C, K) and conversions between them (complete Homework 4 by Monday-it will not be turned
in)
Earth-Sun
orientation as Earth orbits around sun.
Tilt of Earth’s rotational axis contributes to different seasons,
related to where/when sunlight is incident most directly on the Earth’s surface
ITCZ- intertropical convergence zone (heat
equator) moves north and south of geographical equator depending on season (it
occurs where sunlight is most direct).
Intro
to general circulation- a consequence of greater heating from sunlight at the
Equator than at the poles. Global air
circulation follows convective patterns where air rises at 0° and 60° latitude,
and sinks at 30° and 90° latitude.
“Hadley Cell” is convection cell closest to Equator where air rises and
sinks at 30°N and 30°S latitude. The return flow of wind along the Earth’s
surface to replace the rising air results in easterly winds (east to west) from
0-30° latitude, westerlies from 30-60° latitude and easterlies from 60-90°
latitude.
Homework 4 exercise
to draw vertical and horizontal circulation (convection cells), as well as
predominant wind directions associated with various latitude bands (by Monday).
Mon.
Jan. 31
Answers
to Q1 were discussed; 19.2 was average; +1 “quiz adjust points” will be added
to your raw score in the master gradesheet.
Make-up
opportunities for GA #1- Wed
11-12, room 330 Space Sciences; Prepare for group activity by researching composition
of TITANIUM following the instructions provided and bringing in at least 2
printed/photocopied pages of relevant
information. 14 Grand Challenges for Engineers for the
21st Century- several of which directly relate to topics of this
class.
Short
oil video at beginning of class related to
earth resources and rising price of resources, (metals and) petroleum
Review
Earth timeline of major natural global changes, including origin and abundance
of life; early “weak sun” and the role of greenhouse gases; cyanobacteria
(stromatolites
)
and changing atmospheric oxygen concentrations; banded iron formations (BIF)
representing precipitation in early oceans of Fe2+ with oxygen
liberated by photosynthesis, thus preventing an early build up of oxygen in the
atmosphere until all of the Fe2+ was “used up”. Fe2+
would be considered a “sink” for oxygen, as the first oxygen form was rapidly
consumed by forming Fe-oxides
Today’s
atmosphere dominated by nitrogen (78%), oxygen (21%), argon (1%) and “trace
gases”, i.e., it is an “oxidizing” atmosphere. 4.6 billion years volcanic gases were being
emitted containing H2O (dominant), CO2, SO2, H2S,
HCl, H2, CH4, and N2 during initial "outgassing"
of Earth's interior, i.e., a “reducing” atmosphere. H2O condenses to form oceans; H2
escapes to space; SO2 and CO2 readily dissolve in ocean
and precipitate as gypsum and limestone, respectively; photosynthesis builds up
O2 (after BIF oxygen Fe2+ “sink” that removes
oxygen became saturated), although “photodissociation” of water vapor
molecules in upper atmosphere also produces small quantities of H2
and O2. Photosynthesis is a
process/mechanism (“source”) that produces oxygen (CO2 + H2O
=> CH2O + O2 in the presence of chlorophyll and with
energy from sunlight). We will usually
refer to CH2O as “organic matter”
Reverse
reaction of photosynthesis is respiration/combustion/decomposition
Important
properties of the trace gases (list and properties in Homework 4 [do not
turn in])
“Sources”
(mechanism/process for gas getting into atmosphere), “sinks” (mechanism
for removing gas from atmosphere) and importance of some major and trace gases;
for example, H2O and CO2 are most important greenhouse
gases on Earth. Respiration (the reverse reaction of photosynthesis) is a
mechanism (sink) to remove oxygen from the atmosphere (CH2O + O2
=> CO2 + H2O).
The same equation can likewise represent combustion processes that also
remove oxygen from the atmosphere (sink).
Water
vapor (H2O) and carbon dioxide (CO2) are the 2 most
important greenhouse gases on our planet.
Fri.
Jan. 28
Group
Activity 1- Mineral Resources
Wed.
Jan. 26
Quiz
1- first 20 minutes
Students
have some preparation to do for Group Activity 1 before class Friday; You can
find what group you are in (and the instructions for the research that you need
to do prior to class) under D2L content and on links in the course homepage
(accessible from D2L).
Plate
tectonics is directly related to location of natural resources, the extraction
and processing of which can affect atmospheric chemistry, hydrologic cycle,
etc, natural emission of gases.
Chemicals
are heterogeneously distributed across the Earth’s surface. In many cases,
besides earthquakes and volcanoes, the location of ore deposits of specific
metals/elements is related to plate tectonic and plate boundaries. The richness of metal resources of a country
is dictated by their current and past position with respect to plate tectonics
ore-forming processes, and other ore-forming processes such as related to
climate. Ore deposits of some elements
may be as much related to climate as plate tectonics. Table of important elements, their uses,
and sources- Note the USA is only a primary source for a few of the elements.
Raw
resources are very important to our society, but extraction and processing has
its costs (with example of computer chips, in terms of energy, water
and waste, which can contribute to environmental problems and global changes).
The
price of copper (historical graph) and oil over the last 6-8 years was
considered.
Video
of innovative Nepal fuel, which is relevant to Smith’s
“In Praise of Petroleum”.
Mon.
Jan. 24
Your
summary of Lemonick article in Scientific American with your personal thoughts
is due in class on Wednesday, Jan. 26 (1-page, double-spaced).
The
quiz Wed will be given in the first
20 minutes of class, with lecture to follow as is customary. Sample quiz 1 is on D2L with answers soon to
be posted.
We
will have Group Activity 1 on
Friday and instructions will be sent to everyone and to group leaders on
Tuesday. Group lists will shortly appear on D2L and the course webpage- see
what group you are in.
Origin
of Solar System (cont’d)
Matter
was distributed in the solar system such that the internal 4 planet are more
dense and rocky “terrestrial” planets and the outer “Jovian” planets are lower
density, “icy” planets composed of lighter elements/frozen gases. There are
also satellite planets (moons) orbiting around many of these planets, such as
Titan. [not in lecture: over 400 other planets have been observed around other
distant stars, but most are quite different than ours (hotter and much, much
larger!)]
Newton’s
Laws
1st- Every object
persists in a state of rest or in uniform motion in a straight line
unless
acted on by an external force to change that state.
2nd- The change in
velocity (= acceleration) with which an object moves is
directly
proportional to force applied and inversely proportional to the
mass of the
object (a=F/m)
3rd-
Every action has an equal and opposite reaction
(conservation of momentum)
Law
of Universal Gravitation- any and all objects exert a force of attraction
between them proportional to the product of their masses and inversely to the
distance between them squared. (F= G x (m1 x m2)/r2)
(also see Family Guy clip for humorous example)
Newton’s
Law of Universal Gravitation further explored with astrological examples of
gravitational force exerted on you at birth (by closest star other than sun,
and doctor).
Structure of the Earth (heterogeneous
distribution of chemicals with depth=layers)
Earth’s
core is made predominantly of iron
and nickel (like some meteorites). The mantle layer above the core is
primarily magnesium (Mg) and iron (Fe) silicate (Si and O) rock, and the crust on the surface is composed of
silicate rock with less Fe and Mg and more K, Na and Al.
During
early stages of Earth history, our planet was at least partly molten resulting
from heat of collisions and gravitational potential energy converted to heat
energy (decay of radioactive elements was also important source of heat over
all of Earth’s history)
During
this early period, Earth began to “differentiate” into layers with
heavier material “sinking” to interior and lighter material “rising” to
surface. Consequently Earth’s core is made predominantly of iron and
nickel (like some meteorites). The mantle layer above the core is
primarily magnesium (Mg) and iron (Fe) silicate (Si and O) rock, and the crust on the surface is composed of
silicate rock with less Fe and Mg and more K, Na and Al.
Differences in chemistry among
layers (for example low SiO2 in mantle and higher in
continental crust, and
more Fe in mantle and less in crust) is consistent with Earth’s
“differentiation” into the layers early in its history. Continental crust is referred to as having a
granitic composition (K,Na,Fe,Al,Si,O); oceanic crust a basaltic composition
(Mg,Ca,Fe,Al,Si,O). The ocean crust is
also called “mafic” (dominated by Mg and Fe), whereas the mantle is ultramafic
in composition.
Crust
and rigid upper mantle constitute the “lithosphere”. The lithosphere rides over the portion of the
upper mantle (asthenosphere) that flows (heat from Earth’s interior leads to
convection processes in the asthenosphere).
The plates move (cm per year) and interact with each other in a dynamic
system known as “plate tectonics”.
Plate
tectonics and types of plate boundaries (plates colliding = “convergent”
boundary; plates moving apart = “divergent” boundary; plates sliding past each
other = “transform” boundary). Caused by
convection (flow) in upper mantle. Contributes to lateral heterogeneous
distribution of chemicals across the Earth’s surface. Boundaries associated
with earthquakes and volcanoes.
Fri.
Jan 21
Homework
#3 assigned; to be turned in Wednesday Jan. 26 as hard copy- Write a 1-page double-spaced
summary of the content of the Lemonick article in Scientific American. Please feel free to include any of your
personal views in this writing. We
talked about some of the elements of the article in class, related to Judith
Curry’s research into hurricane intensity, interaction with skeptical bloggers,
uncertainty in data and models, “groupthink”, “fortress mentality”, and
predictions of sea-level rise
First
Quiz next Wed. Jan. 26; I’ll put up a sample quiz on D2L this weekend
The
fusion taking place in the Sun and other
stars represents a tremendous energy source, and research has been directed at
trying to promote controlled fusion reactions on Earth as a limitless
source of energy (The world already has many fission reactors in which
large radioactive elements such as uranium, decay and release energy)
Laws
of Thermodynamics
First
Law- Energy cannot be created or destroyed, but it can be converted from one
form to another (examples of energy- heat, like, kinetic energy, electrical
energy, potential energy of petroleum, food and gravity)
Second
Law- No energy transformation is 100% efficient or Energy can be
converted from one form to another but in all conversions there is formation of
some ‘low quality’, ‘non-usable’ heat or Heat cannot be completely
converted to work or Universe runs down as energy is dispersed to
low-quality heat energy or All systems tend to become
random (or dispersed) on their own (or
all energy is not “equal”). Entropy
is a measure of randomness, or dispersion or disorder
Origin
of Solar System
There
was about 10 billion years between the Big Bang and the origin of our Solar
(Sun) system
Our
solar system is made of all the elements of the Periodic Table but only He is
being produced in our solar system currently (in the Sun); therefore all of the
elements had to have been produced in the 10 billion years before the solar
system was formed. (our system is from the remnants of other stars) Solar Nebula Hypothesis has solar system
forming from a rotating ball of dust and gases that flattened to a disk
shape. Most of the mass was in the
center and the pressure and temperature in that environment ignited hydrogen
“burning” (fusion).
Wed.
Jan. 19
First
Quiz next Wednesday (Jan. 26)
We
need someone to provide their class notes for DRC students. Let Prof. Leavitt
or Rebecca know of your interest, and we can devise a way of providing them.
We
need 5 or 6 interested and responsible students to be group leaders (for 6
group activities), and receive 5 EC points. Let Prof. Leavitt know your
interest.
We
went over some answers to Homework #2 that had been handed out in
class on Jan. 14. You will be quizzed on
these skills in the first Quiz next Wed. Jan. 27.
Grand
story of epic proportions:
ØOnly
H
and
He
(the
most
abundant
elements
in
the
Universe)
were
formed
in
the
"Big
Bang"
13-15
billion
years
ago;
evidence
of
the
Big
Bang
event
is
seen
in
the
galaxies
moving
away
from
us
at
high
speeds;
the
more
distant
the
galaxy,
the
faster
it
is
moving
from
away
from
us;
Wavelengths
are
characteristic
of
electromagnetic
radiation
such
as
visible
light
(short
wavelengths
correspond
to
low
pitch
for
sound
waves,
and
red
color
for
visible
light
waves;
long
wavelengths
correspond
to
high
pitch
for
sound
waves,
and
purple
color
for
visible
light
waves;
see
"electromagnetic radiation");
The
“Red Shift” of
visible
light
is
associated
with
the
“Doppler
Effect”
indicates
galaxies
are
moving
away
from
us
at
high
speed
to
shift
light
toward
longer
wavelengths
(red). Video of
eye-popping,
jaw-dropping,
awesome
reenactment
of
the
Big
Bang
using
a
balloon
with
some
marks
on
it,
in
full
special
effects
mode
with
Dolby®
Surround-sound®,
and
3-D
glasses,
which
illustrates
how
the
galaxies
farthest
away
could
be
moving
at
the
greatest
speeds.
ØElements
from
lithium
(Li)
to
iron
(Fe)
(also
He)
produced
in
the
interior
of
normal
stars
by
“fusion”
processes,
i.e.,
lighter
elements
being
combined
to
manufacture
heavier
elements. For example,
in
our
Sun,
fusion
takes
place
converting
4
hydrogen
atoms
(1
proton
in
each
nucleus
=
4
nuclear
particles)
to
one
helium
atom
(2
protons
and
2
neutrons
in
nucleus=
4
nuclear
particles);
the
mass
of
the
helium
atom
is
less
than
the
4
hydrogens,
so
the
difference
in
mass
is
what
was
converted
to
energy
that
contributes
to
the
internal
heat
of
the
Sun
(E=mc2);
The
energy
from
such
nuclear
reactions
(involving
nuclei
of
atoms)
>>
energy
from
chemical
reactions
(involving
electrons
of
atoms);
The
fusion
taking
place
in
the
Sun
and
other
stars
represents
a
tremendous
energy
source,
and
research
has
been
directed
at
trying
to
promote
controlled
fusion
reactions
on
Earth
as
a
limitless
source
of
energy
(The
world
already
has
many
fission
reactors
in
which
large
radioactive
elements
such
as
uranium,
decay
and
release
energy)
ØElements
up
to
Iron
can
be
produced
by
fusion
because
energy
is
released;
Elements
beyond
(heavier
than)
iron
cannot
be
produced
by
fusion,
but
can
be
produced
by
high
fluxes
of
neutrons
that
are
captured
in
the
nuclei
of
existing
atoms;
such
neutron
fluxes
occur
in
interior
of
massive
stars
and
when
stars
explode
(supernova). Our sun
has
all
of
the
elements
of
the
Periodic
Table,
but
it
is
only
making
He
through
fusion-
Why?
Fri.
Jan. 14
Syllabus handed out and key points reviewed; course web site
is accessible through D2L containing many links for syllabus, website,
homework, readings, skills, etc.
Daily
readings from Mann/Kump (required) and Mackenzie (recommended) textbooks are
listed in syllabus, but additional readings will be announced and made
available through course web site;
You
are responsible for knowing what is in the syllabus, particularly related to
instructors contact information, policies, deadlines, grading, etc……at least 2
questions on first quiz will come
from list of questions at end of syllabus.
Course
content involves Earth’s systems, natural and human-induced mechanisms of
global change, and nature of global changes.
Student
can earn up to 6 Extra Credit points that will be added directly on to their
final cumulative course grade (a number between 0 and 100%)!
Note: Office hours in room 330 Space Sciences are available immediately before (11-12 with TA Rebecca) and immediately
after (1-2 with Prof. Leavitt) our class on Mon. and Wed.
Cheating/plagiarism is dangerous in this class-
it can get you a recommendation for grade of “E” and referral to Dean
Don’t
distract instructor or
students with ringing cellphones, newspaper readings, sleeping, extended
conversations, etc!
Attached
to syllabus was also Homework 2 (atom size [diameter, mass], moles, speed of
light, conversions, etc) containing problems for students to work and Periodic Table; Homework 2 will not be
graded. If anything is not clear, Homework 1 has lots of explanation about
scientific notation, graphs, conversions, etc (likewise, it is not to be turned
in or graded). Both homeworks are
available on the course homepage as well.
The
AD 535global catastrophe was described based on the ‘Cerceo’ required reading,
whose thesis is that some catastrophes we are helpless to prevent, but others
(global warming related to use of fossil fuels) we can.
Class
was also asked about main points from the ‘August’ opinion piece in the Tucson
Weekly, in regard to “old ways”, sustainability, locavores, and flourishing or
collapse of societies. No one knew what
a locavore was, and all were asked to find out by the next class.
The
fragility (uniqueness?) of blue Earth in the universe was portrayed with Earth
viewed from Apollo and Voyager.
Characteristics
of matter
All matter is made of small particles
(atoms and their constituents)
Atoms of the same element have similar
chemical properties
Atoms are not divided by chemical
reactions
Chemical reactions involve electrons;
nuclear reactions involve protons/neutrons
(in a column of period table different
elements may behave similarly in chemical rxns)
Periodic
Table
Elements
arranged according to increasing Atomic
Number (number of protons).
(This arrangement is also related to
filling of electrons in discrete
electron “shells”)
Each element has name and 1- or 2-letter
shorthand notation.
When an atom is “neutral”, it will have
an equal number of protons (+) in nucleus and
electrons (-) orbiting nucleus. Neutrons
(no charge) also can reside in nucleus at the
center of atoms.
Intro
to “grand story” of epic proportions regarding time, space, power, fire and
ice, attraction and repulsion, collisions and explosions (sort of like Lord of
the Rings, Star Wars, Bible, etc). The “Epic Story” told in the Periodic Table
of Elements, which establishes a context of time and space in which our world
exists
Wed.
Jan. 12 (Wed.)
No
class; University cancelled classes on
Wednesday because of the tragic events of last Saturday, Jan. 8
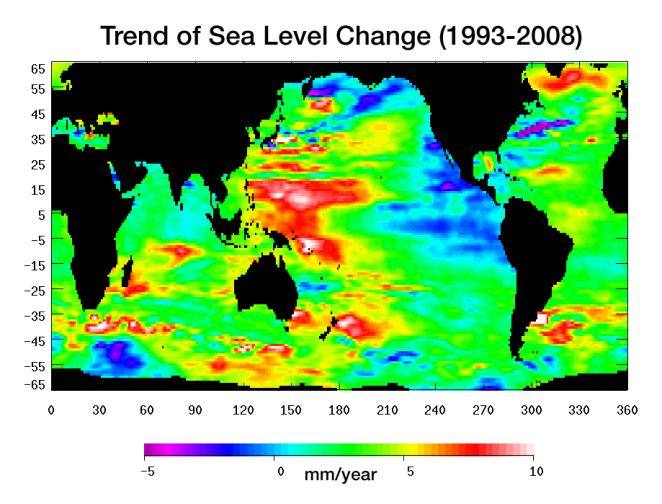