NATS 101
Description and Exercises on:
“Conversions”
“Graphs”
“Periodic Table of the
Elements”
This self-study begins with background information about converting
between units, cancelling of units in equations, conversion to and from
scientific notation, and interpreting graphs.
If you feel comfortable with these areas, then you may skip to the exercises
section.
I. Conversions: Units
Converting
from one system of measurement to another is like translating from one language
to another, except that we use equations to make the change. The examples below demonstrate the
procedure.
Example
1: You have borrowed your friend's old 1971 Toyota Landcruiser for a scuba trip
to San Carlos, Mexico. Deeper into
Mexico the speed is only posted in kilometers per hour, but the Landcruiser
speedometer is only marked in miles per hour.
You want to get there as fast as possible, but you really don't want to
get pulled over. The posted speed is
120 km (kilometers per hour). How fast
can you travel in miles per hour without 'adverse consequences'?
![]() (Read this as “the number of kilometers per hour,
times 1 mile per 1.609 kilometers, equals the number of miles per hour.”)
(Read this as “the number of kilometers per hour,
times 1 mile per 1.609 kilometers, equals the number of miles per hour.”)
Solution:
120km/hr x 1mi/1.609km = 74.58 miles/hr, so you can drive at just under 75
miles per hour and not get pulled over (assuming the speedometer is accurate!)
Example
2: You are at a store buying a microwave oven for your apartment. It must fit on the kitchen counter under a
cabinet in a space you measured to be 21in wide by 15in high by 19in deep. The measurements on the microwave you want,
are in metric units. Oh No! Will a microwave oven 45cm wide by 39cm high
by 43cm deep fit on your counter?
We
know from the conversions table that 1 inch = 2.54 centimeters, and 1cm =
0.3937 inches, so we can solve this problem going either direction. Here are the ways to set up the equations:
(1)
Solution for space: inches to centimeters (need space larger than microwave
size)
![]() (Read this as “the number of inches, times 2.54
centimeters per inch, equals the number of centimeters”) Plug in the
measurements you made.
(Read this as “the number of inches, times 2.54
centimeters per inch, equals the number of centimeters”) Plug in the
measurements you made.
(a)
21in(2.54cm/1in) = 53.3cm
(b)
15in (2.54cm/1in) = 38.1cm
(c)
19in(2.54cm/1in) = 48.3cm
53.3cm
is greater than (>) 45cm wide
38.1cm is less than (<) 39cm high
48.3cm
is greater than (>) 43cm deep
(2)
Solution for microwave size: centimeters to inches (need microwave size smaller
than space)
![]() (Read this as “the number of centimeters, times 0.3937
inches per centimeter, equals the number of inches.)
(Read this as “the number of centimeters, times 0.3937
inches per centimeter, equals the number of inches.)
(a)
45cm(0.3937in/1cm) = 17.7in
(b)
39cm(0.3937in/1cm) = 15.4in
(c)
43cm(0.3937in/1cm) = 16.9in
17.7in
is less than (<) 21in wide
15.4in is greater than (>) 15in high
16.9in
is less than 19in deep
The microwave oven is too high for the
space.
II. Conversions: Cancelling Units
The units of measure must be
accounted for in any conversion. The
units are obvious in simple conversions:
|
|
|
|
from Example 1 may also be written
Notice
that the km units cancel out when
they occur in both the numerator and the denominator, leaving mi as the final unit. Think of units in fractions as numbers, in a
sense. Where 3/3=1, simplifying the
threes to 1, km/km simplify and cancel out.
But why bother? Well, cancelling
out units also allows you to make certain that you have the conversion set up
correctly. For example:
|
|
|
|
(an
incorrect conversion) expands to
leaving
km times km per mi, or km2/mi, obviously NOT what you wanted!
III.
Conversions: Scientific Notation (see http://www.ieer.org/clssroom/scinote.html for more)
What is scientific
notation? Scientific notation is a way
of expressing very large or very small numbers in a form that's short and easy
to use. Consider the number 5,681,805,550,528.27. This is the U.S. National Debt on Jan 7,
2001 4:49:39 PST (from the following URL: http://www.brillig.com/debt_clock/). If we round this number off to the second
digit it still takes a lot of space: 5,700,000,000,000.00 dollars. However, if we remember that each place to
the right or left means multiplying or dividing by ten, then we can shorten the
way the number is written. 1000 is 10
times 10 times 10, or 103.
Using this transformation, 5,700,000,000,000.00 dollars becomes 5.7 x 10¹²dollars. Starting from the left, count the places from the right of the first number to
the decimal point 5,700,000,000,000.00
(highlighted), then move the decimal point to the position immediately to the
right of the first number, and use the number of places counted to give you the
'power of ten'.
Likewise, the size of a Hydrogen
atom may be written 0.000000012 meters.
If we wanted to determine how many Hydrogen atoms were present in 1m3
(cubic meter) at the center of our sun, then the size of the Hydrogen atom
would need to be expressed in meters.
Similarly, starting from the left, count the number of places between
the decimal point and the first number (including the number) 0.000000012 (highlighted), move the
decimal point to the position immediately to the right of the first number, and
use the number of places counted to give us the 'power of ten' (in this case a
negative power because the number is less than 1). So, 0.000000012m becomes 1.2 x 10⁻⁸m.
We simply reverse the process to
convert to general format. For the first
example, a positive exponent, we move the decimal point 12 places to the
right. For the second example, a
negative exponent, we move the decimal point 8 places to the left.
IV. Interpreting Graphs
Graphs allow us to present a lot
of information in a small space, and to make it more easily
understandable. If we wanted to know
how many days in a semester every student showed up for class and what day had
the lowest student attendance, we might keep a running count for each class
session. We could get the information
we want by looking down the table of numbers, but we can instantly see the
highs and lows if we make a plot of days against student attendance.
On the next page I have produced
a fake graph of student attendance for a class of 62 students, and added other
information in the text that might be used to interpret the graph. The scale across the bottom of the graph is
time. The scale along the left side of
the graph is the number of students attending.
Now we find the place on the grid (lines) in between for each pair of
numbers. For instance, on day 29 there
were 57 students in class. So the place
where day 29 (moving up from the bottom scale) and 57 students (moving over
from the left scale)intersect becomes a unique dot on the graph telling us both
values.
The time axis (the x-axis), says
“Days from 1/1/2001”. The tick marks on
this axis are at 7 day intervals allowing any weekly information to be easily
seen. The axis for the number of
students (the y-axis), says “Number of Students”(duh). The tick marks for this axis mark off the
student attendance in fives.
From the fake class syllabus I
know that the dates for the exams were Feb 16th, March 14th,
April 13th, and May 11th. These are Julian Days 47,73,103, and 131, respectively. Also, Spring Break was from March 17th-
March 25th. The lines
between the datapoints are not real, of course. No students were attending class when there was no class. But these lines help us to see patterns in
the data through time.
|
|
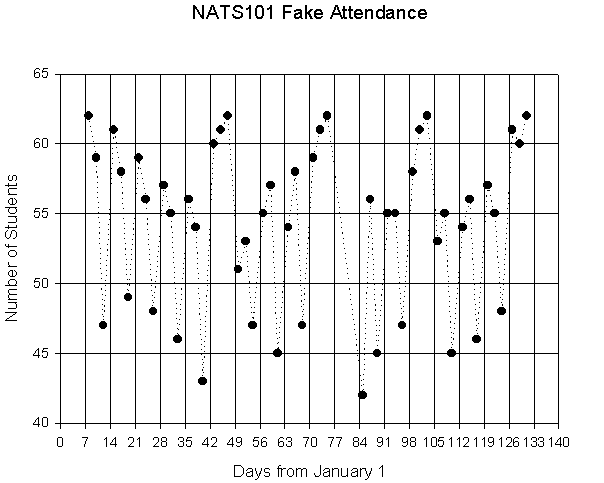
So what interpretations can we
make? We can immediately see a pattern
related to the time crossbars, placed at 7 day intervals. These students tended to come to class on
Mondays and Wednesdays, and miss Fridays.
Also, notice the gradual dropoff in attendance over the first five weeks
of class, then a resurgence before the first exam. In fact, this pattern recurs before each exam. Also, note that the lowest attendance was on
the Monday immediately after Spring Break.
If we trace up from the x-axis on this day (Day 85), and over from the
y-axis, we see that only 42 students showed up for class that day. The same procedure also tells us that all
students showed up on 5 days, those days being the first day of class and each
exam.
Assignments: Solve these Problems
(Two tables of conversions are provided at the end of this document)
(1) Assignment 1: Conversion of Units
(1a)
Problem 1: On the same trip mentioned in Example 1, you are well into Mexico
and you realize your gas gauge is at the edge of the red mark. Your friend told you the Landcruiser gets 23
miles to the gallon on the highway. He
also told you that there will be 1.5 gallons left when you reach the red. San Carlos is still 50 kilometers away. The 1.5 gallons left in your gas tank will
take you about 34 miles. Will you be
able to travel at least 50 kilometers?
(show
the calculations)
(1b)
Problem 2: The purpose of your trip to Mexico is to see the rare blue Mugglump
in its native environment. Your UA
oceanography professor told you the Mugglump has only been reported in the Gulf
of California in water colder than 71EF. You don't own an underwater thermometer, but
a local marine research facility reports a temperature close to your dive area
of 21EC at 30m down, as deep as you can go. Can you reach the habitat of the Mugglump by
diving this deep? In other words, what
is this temperature in EF? (show your
calculations)
(2) Assignment 2: Conversion to and from
Scientific Notation (a page on scientific notation is available at the end of
this document) Also, you can check
you answers at http://www.quickmath.com/.
Use the information provided on
the pages on conversions at the end of this homework to convert these numbers
(fill in the blanks).
|
General
Notation |
Scientific
Notation |
|
13,500,000 Pascals (Pa) |
|
|
|
4.5 x 10⁻⁹ liters (l) |
|
0.000000071 kilometers (km) |
|
|
|
1.23 x 10¹⁸ kilograms (kg) |
(3) Assignment 3: Graph Interpretation
On the next page are two
graphs. The first graph presents the
carbon dioxide (CO2) concentration as measured at Mauna Loa, Hawaii
from 1958-1995. The second graph
presents CO2 concentration reconstructed, at irregular time
intervals, from gas trapped in an ice core collected at Taylor Dome,
Antarctica. Answer the following questions
about these graphs.
(3a)
Years are the unit plotted on the x-axis on these two graphs. The most recent data points on the first
graph are on the right side. Is this
true for the second graph?
(3b)
The y-axes on both graphs present CO2 concentration in parts per
million by volume. What is the range of
concentrations presented on the first graph (to the closest 5ppmv)? What is the range on the second graph (to
the closest 5ppmv)?
(3c)
In what year do we see the highest CO2 concentration in the first
graph? What is the concentration (to
the nearest 5 ppmv)?
(3d)
At what time do we see the lowest CO2 concentration in the second
graph (to the nearest thousand years)?
What is the lowest concentration (in ppmv)? What is the difference (mathematically) between the highest
concentration in the first graph and the lowest concentration in the second
graph? (show your calculations)
(3e)
What is the change in CO2
concentration between 1958 to 1967 (10 years), early in the history of the measurements,
and 1989 to 1998 (10 years), the latest years on the first graph? (show your calculations)
|
|
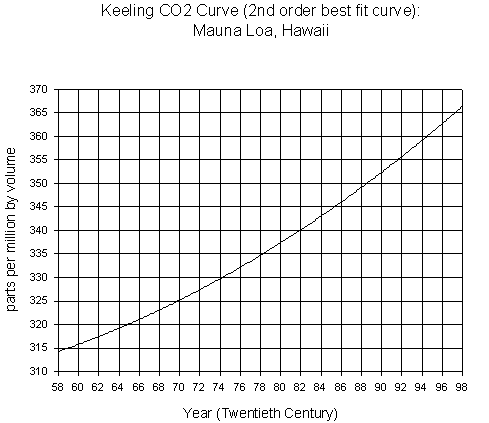
Graph 1
|
|
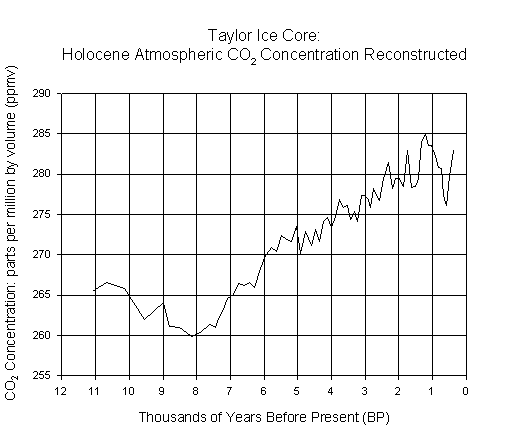
Graph 2
4.
Assignment 4: Periodic Table of the Elements
Atoms are composed of neutrons
(neutral charge), protons (positive charge) and electrons (negative
charge). The neutrons and protons are
located in the nucleus and the electrons revolve around the nucleus. When the number of electrons and protons in
an atom are equal, the atom is “neutral”; if they are not equal, the atom is
“ionized”. The Periodic Table of the
Elements ranks the chemical elements in order of increasing number of protons,
known as the atomic number.
What chemical elements correspond
to the following atomic numbers (put down the 2-letter chemical symbol and
the full name);
1 = _______________________________ 12 = ______________________________
A
periodic table of the elements is provided on the next page.
5.
Assignment 5: Images of Global Change
Select an image from the page of
images on a later page. In one
paragraph (at least 150 words), describe one image (or two in the cases of the
Tucson images and the glacier images) and suggest how the subject of the image
might be related to Global Change. Keep
in mind that this is a Tier 1 course, and as such has a writing
requirement. We expect your grammar to
be correct, your sentences to be complete, and your thoughts to be organized before you begin writing, and we will
grade accordingly. Outline your thoughts immediately below, then write from the
outline. The paragraph must be typed (double-spaced) on a separate piece of
paper and included with this homework.
6.
Assignment 6: Computer Lab
Read through the “Earth and
Space” computer based lab exercise.
This lab exercise is available at http://www.hwr.arizona.edu/Alpine/IGCL/home.html.
SI (Système Internationale) Units and
Conversion Factors
SI Prefixes: Those commonly used (abbreviations in parentheses)
|
|
Greater Than 1 |
|
|
Less Than 1 |
|
|
hecto- |
100 |
103 |
centi- |
0.01 |
10!2 |
|
kilo- |
1,000 |
103 |
milli- |
0.001 |
10!3 |
|
mega- |
1,000,000 |
106 |
micro- |
0.000001 |
10!6 |
|
giga- |
1,000,000,000 |
109 |
nano- |
0.000000001 |
10!9 |
Conversions
|
SI SYSTEM TO ENGLISH |
ENGLISH SYSTEM TO SI |
Length/Area:
Common conversions, base unit = meter
(m)
|
1 meter (m) = |
1.0936
yards 39.37 inches (in or ") |
1 yard = [3 feet or 36 inches] |
0.914 meters |
|
1 centimeter (cm) = |
0.3937 inches (in or ") |
1 inch = |
2.54 centimeters |
|
1 kilometer (km) = |
0.62137 miles (mi) |
1 mile = |
1.609 kilometers |
|
1 hectare = |
2.471
acres [107,600 ft2] |
1 acre = [43,560 ft2] |
0.405 hectares |
Volume:
Common conversions, base unit = liter
(l)
|
1 liter (l) = |
0.264
gallons (gal) [1.057 quarts (qt)] |
1 gallon = [4 quarts] |
3.785 liters |
|
1 milliliter (ml) = |
0.03381 fluid ounces (oz) |
1 fluid ounce = |
29.57 milliliters |
Mass:
Common conversions, base unit = gram
(gm)
|
1 gram (gm) = |
0.03527 ounces (oz) |
1 ounce = |
28.35 grams |
|
1 kilogram (kg) = |
2.205 pounds (lb) |
1 pound = |
0.454 kilograms |
Other
Common conversions
|
Energy:
1 joule (J) = |
0.239
calories, (cal) [0.000948 British Thermal Units, btu] |
1 calorie = [0.0397 btu] |
4.19 joules |
|
Pressure: 1
pascal (Pa) = [0.01 millibars] |
0.000009869 atmospheres (atm) |
1 atmosphere = [14.7 pounds per square inch (psi)] |
101300
Pascals [1013 millibars] |
|
Temperature: 0 Kelvin (°K) = |
-273.15E Celsius,
(°C) -459.7E Fahrenheit,
(°F) |
0EC = [°C
= 5/9(°F-32)] 32EF = [°F = (9/5°C)+32] |
273.1K [K
= °C +273.15] [°C
= K - 273.15] |
|
Astronomical Unit (AU) 1
AU=149,597,870km = |
92,955,807 miles |
1 AU is the average distance between
the Earth and the Sun |
|
For
more SI notation, units and conversions:
http://www.chemie.fu-berlin.de/chemistry/general/si_en.html
For
more conversions, including unusual and obsolete ones, look here: http://www.convert-me.com/en/
Scientific Notation
The
notation is based on powers of base number 10. The general format looks
something like this:
N
X 10x where N= number greater than 1 but less
than 10 and
x=exponent of 10.
Placing
numbers in exponential notation has several advantages.
1.For very large numbers and extrememly
small ones, these numbers can be placed in scientific notation in order to
express them in a more concise form.
2.In addition, numbers placed in this
notation can be used in a computation with far greater ease. This last
advantage was more practical before the advent of calculators and their
abundance.
In
scientific fields, scientific notation is still used. Let's first discuss how
we will express a number greater than 10 in such
notational
form.
Numbers Greater Than 10
1.We first want to locate the decimal and
move it either right or left so that there are only one non-zero digit to its
left.
2.The resulting placement of the decimal
will produce the N part of the standard scientific notational expression.
3.Count the number of places that you had to
move the decimal to satisfy step 1 above.
4.If it is to the left as it will be for
numbers greater than 10, that number of positions will equal x in the general
expression.
As
an example, how do we place the number
23419
in
standard scientific notation?
1.Position the decimal so that there is only
one non-zero digit to its left. In this case we end up with
2.3419
2.Count the number of positions we had to
move the decimal to the left and that will be x.
3.Multiply the results of step 1 and 2 above
for the standard form:
So we have: 2.3419 X 10⁴
How about numbers less than one?
We
generally follow the same steps except in order to position the decimal with
only one non-zero decimal to its left, we will have to move it to the RIGHT.
The number of positions that we had to move it to the right will be equal to
-x. In other words we will end up with a negative exponent.
Negative
exponents can be rewritten as values with positive exponents by taking the
inversion of the number.
For
example: 10-5 can be rewritten as 1/ 105.
Here
is an example to consider:
Express
the following number in scientific notation:
0.000436
1.First, we will have to move the decimal to
the right in order to satisfy the condition of having one non-zero digit to the
left of the decimal. That will give us:
4.36
2.Then we count the number of positions that
we had to move it which was 4. That will equal -X or x = -4
And the expression will be 4.36 X 10⁻⁴
What about numbers that are between 1 and
10?
In
those numbers we do not need to move the decimal so the exponent will be zero.
For example:
7.92
can be rewritten in notational form as:
7.92
X 100